Energy Efficiency Reimagined NASDAQ: TGEN 3rd Quarter 2018 Earnings Review November 13, 2018
Participants Benjamin Chief Executive Officer Locke Robert President & Chief Operating Panora Officer Bonnie Brown Chief Accounting Officer 2
Safe Harbor Statement This presentation and accompanying documents contain “forward-looking statements” which may describe strategies, goals, outlooks or other non-historical matters, or projected revenues, income, returns or other financial measures, that may include words such as "believe," "expect," "anticipate," "intend," "plan," "estimate," "project," "target," "potential," "will," "should," "could," "likely," or "may" and similar expressions intended to identify forward-looking statements. These statements are only predictions and involve known and unknown risks, uncertainties, and other factors that may cause our actual results to differ materially from those expressed or implied by such forward-looking statements. Given these uncertainties, you should not place undue reliance on these forward-looking statements. Forward-looking statements speak only as of the date on which they are made, and we undertake no obligation to update or revise any forward-looking statements. In addition to those factors described in our Annual Report on Form 10-K and our Quarterly Reports on Form 10-Q under “Risk Factors”, among the factors that could cause actual results to differ materially from past and projected future results are the following: fluctuations in demand for our products and services, competing technological developments, issues relating to research and development, the availability of incentives, rebates, and tax benefits relating to our products and services, changes in the regulatory environment relating to our products and services, integration of acquired business operations, and the ability to obtain financing on favorable terms to fund existing operations and anticipated growth. In addition to GAAP financial measures, this presentation includes certain non-GAAP financial measures, including adjusted EBITDA which excludes certain expenses as described in the presentation. We use Adjusted EBITDA as an internal measure of business operating performance and believe that the presentation of non-GAAP financial measures provides a meaningful perspective of the underlying operating performance of our current business and enables investors to better understand and evaluate our historical and prospective operating performance by eliminating items that vary from period to period without correlation to our core operating performance and highlights trends in our business that may not otherwise be apparent when relying solely on GAAP financial measures. 3
Earnings Call Agenda Benjamin Locke Introduction Why Tecogen Third Quarter Review Recent Achievements Robert Panora Technology Update Bonnie Brown Financial Review Benjamin Locke Opportunities and Outlook Q&A 4
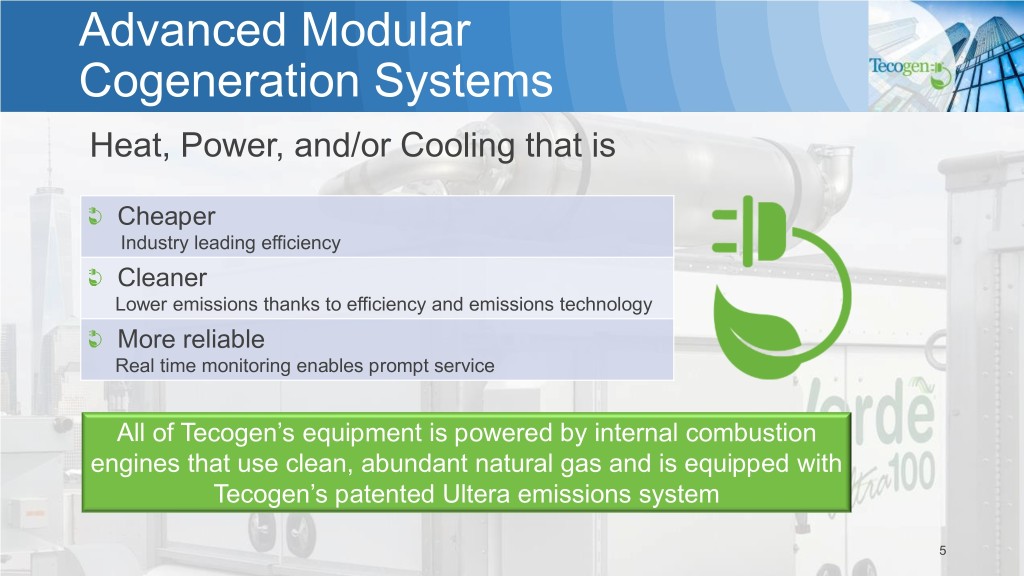
Advanced Modular Cogeneration Systems Heat, Power, and/or Cooling that is Cheaper Industry leading efficiency Cleaner Lower emissions thanks to efficiency and emissions technology More reliable Real time monitoring enables prompt service All of Tecogen’s equipment is powered by internal combustion engines that use clean, abundant natural gas and is equipped with Tecogen’s patented Ultera emissions system 5
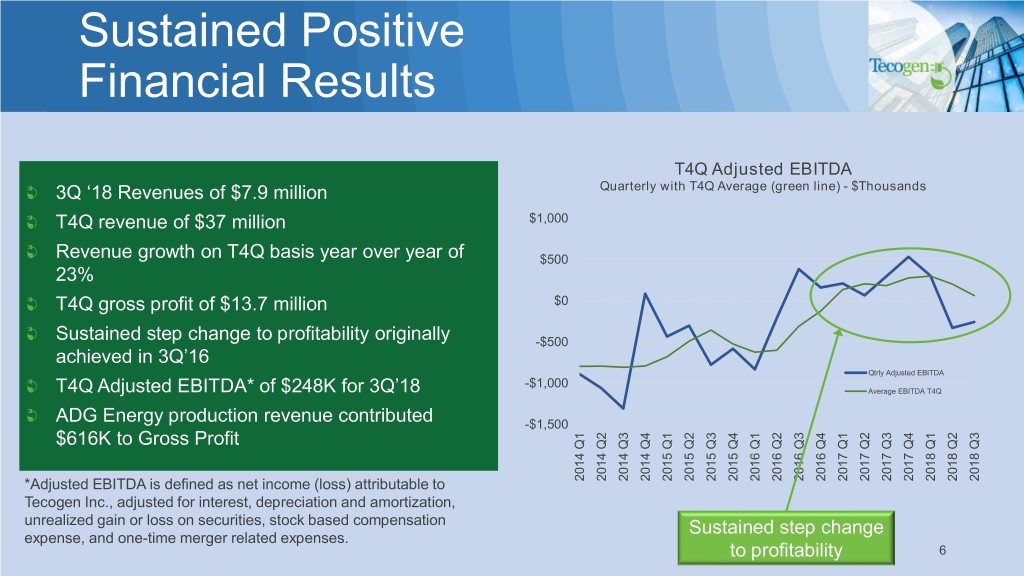
Sustained Positive Financial Results T4Q Adjusted EBITDA 3Q ‘18 Revenues of $7.9 million Quarterly with T4Q Average (green line) - $Thousands T4Q revenue of $37 million $1,000 Revenue growth on T4Q basis year over year of $500 23% T4Q gross profit of $13.7 million $0 Sustained step change to profitability originally -$500 achieved in 3Q’16 Qtrly Adjusted EBITDA -$1,000 T4Q Adjusted EBITDA* of $248K for 3Q’18 Average EBITDA T4Q ADG Energy production revenue contributed -$1,500 $616K to Gross Profit 2014 Q2 2014 Q3 2014 Q4 2014 Q1 2015 Q2 2015 Q3 2015 Q4 2015 Q1 2016 Q2 2016 Q3 2016 Q4 2016 Q1 2017 Q2 2017 Q3 2017 Q4 2017 Q1 2018 Q2 2018 Q3 2018 *Adjusted EBITDA is defined as net income (loss) attributable to Q1 2014 Tecogen Inc., adjusted for interest, depreciation and amortization, unrealized gain or loss on securities, stock based compensation Sustained step change expense, and one-time merger related expenses. to profitability 6
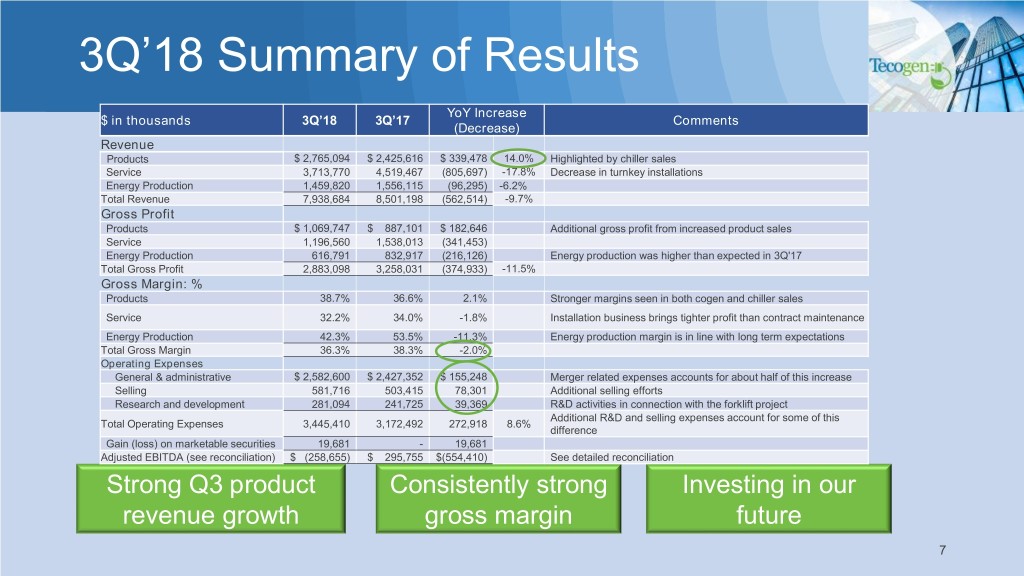
3Q’18 Summary of Results YoY Increase $ in thousands 3Q’18 3Q’17 Comments (Decrease) Revenue Products $ 2,765,094 $ 2,425,616 $ 339,478 14.0% Highlighted by chiller sales Service 3,713,770 4,519,467 (805,697) -17.8% Decrease in turnkey installations Energy Production 1,459,820 1,556,115 (96,295) -6.2% Total Revenue 7,938,684 8,501,198 (562,514) -9.7% Gross Profit Products $ 1,069,747 $ 887,101 $ 182,646 Additional gross profit from increased product sales Service 1,196,560 1,538,013 (341,453) Energy Production 616,791 832,917 (216,126) Energy production was higher than expected in 3Q'17 Total Gross Profit 2,883,098 3,258,031 (374,933) -11.5% Gross Margin: % Products 38.7% 36.6% 2.1% Stronger margins seen in both cogen and chiller sales Service 32.2% 34.0% -1.8% Installation business brings tighter profit than contract maintenance Energy Production 42.3% 53.5% -11.3% Energy production margin is in line with long term expectations Total Gross Margin 36.3% 38.3% -2.0% Operating Expenses General & administrative $ 2,582,600 $ 2,427,352 $ 155,248 Merger related expenses accounts for about half of this increase Selling 581,716 503,415 78,301 Additional selling efforts Research and development 281,094 241,725 39,369 R&D activities in connection with the forklift project Additional R&D and selling expenses account for some of this Total Operating Expenses 3,445,410 3,172,492 272,918 8.6% difference Gain (loss) on marketable securities 19,681 - 19,681 Adjusted EBITDA (see reconciliation) $ (258,655) $ 295,755 $(554,410) See detailed reconciliation Strong Q3 product Consistently strong Investing in our revenue growth gross margin future 7
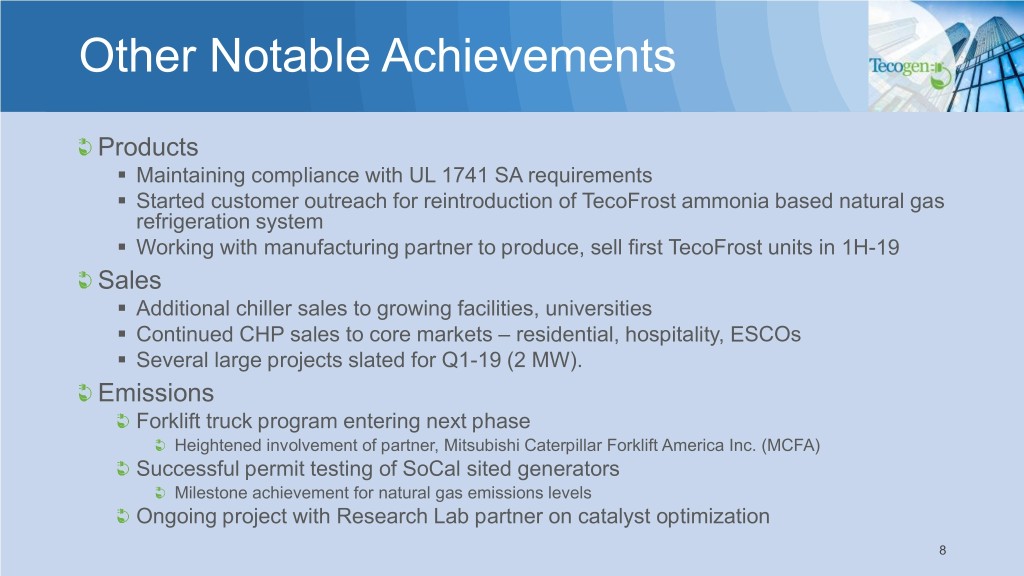
Other Notable Achievements Products ▪ Maintaining compliance with UL 1741 SA requirements ▪ Started customer outreach for reintroduction of TecoFrost ammonia based natural gas refrigeration system ▪ Working with manufacturing partner to produce, sell first TecoFrost units in 1H-19 Sales ▪ Additional chiller sales to growing facilities, universities ▪ Continued CHP sales to core markets – residential, hospitality, ESCOs ▪ Several large projects slated for Q1-19 (2 MW). Emissions Forklift truck program entering next phase Heightened involvement of partner, Mitsubishi Caterpillar Forklift America Inc. (MCFA) Successful permit testing of SoCal sited generators Milestone achievement for natural gas emissions levels Ongoing project with Research Lab partner on catalyst optimization 8
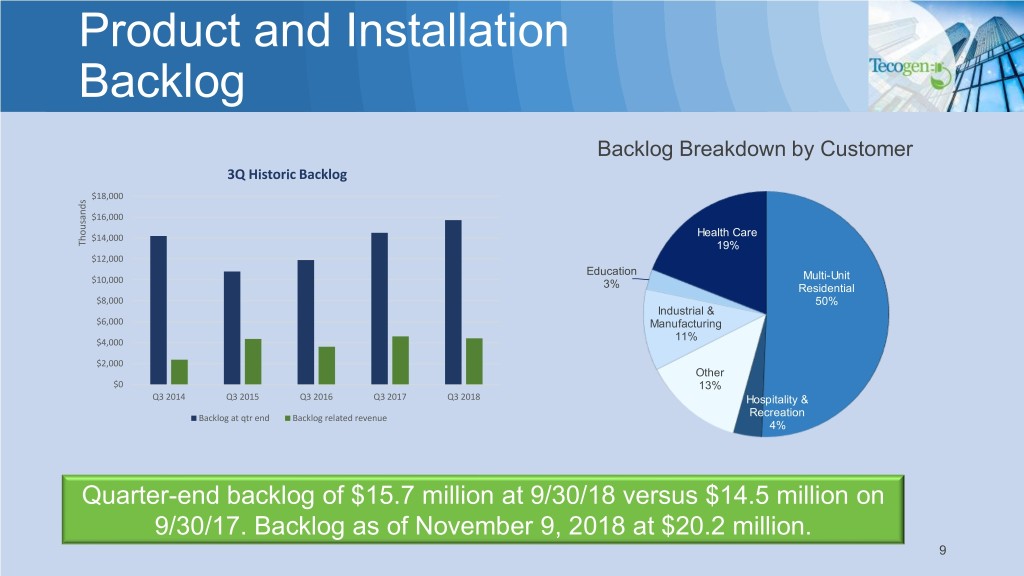
Product and Installation Backlog Backlog Breakdown by Customer 3Q Historic Backlog $18,000 $16,000 $14,000 Health Care Thousands 19% $12,000 Education $10,000 Multi-Unit 3% Residential $8,000 50% Industrial & $6,000 Manufacturing 11% $4,000 $2,000 Other $0 13% Q3 2014 Q3 2015 Q3 2016 Q3 2017 Q3 2018 Hospitality & Recreation Backlog at qtr end Backlog related revenue 4% Quarter-end backlog of $15.7 million at 9/30/18 versus $14.5 million on 9/30/17. Backlog as of November 9, 2018 at $20.2 million. 9
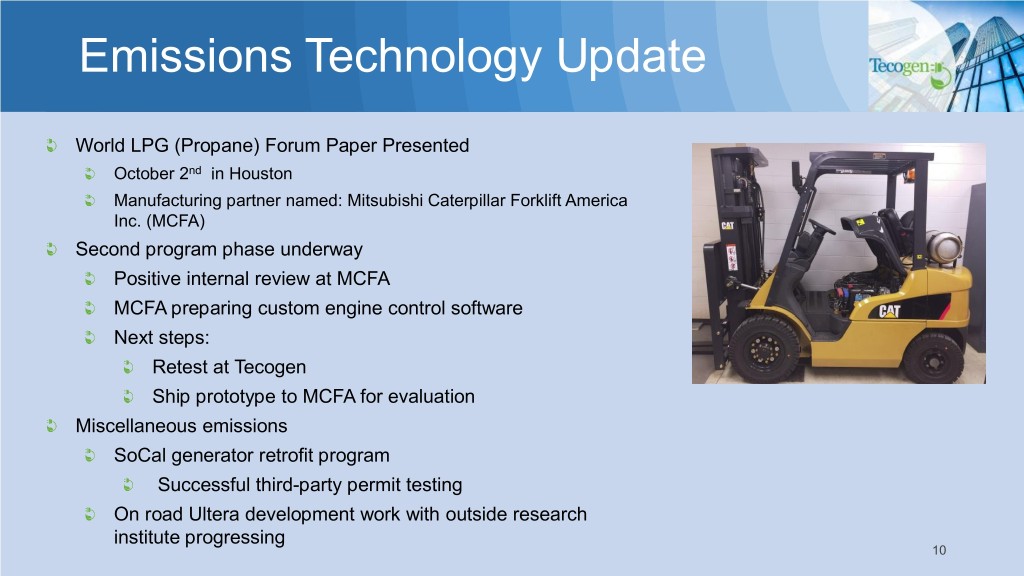
Emissions Technology Update World LPG (Propane) Forum Paper Presented October 2nd in Houston Manufacturing partner named: Mitsubishi Caterpillar Forklift America Inc. (MCFA) Second program phase underway Positive internal review at MCFA MCFA preparing custom engine control software Next steps: Retest at Tecogen Ship prototype to MCFA for evaluation Miscellaneous emissions SoCal generator retrofit program Successful third-party permit testing On road Ultera development work with outside research institute progressing 10
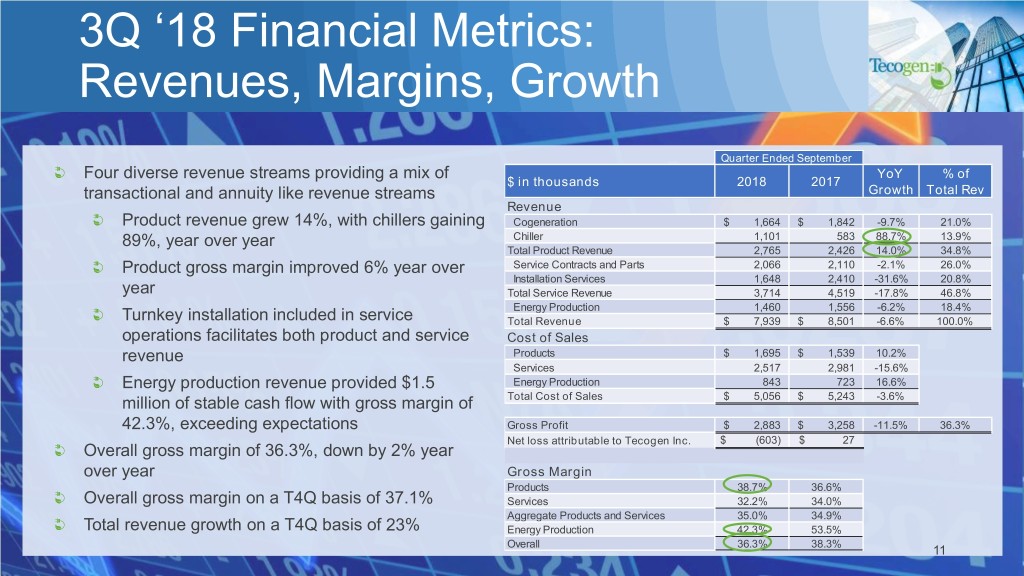
3Q ‘18 Financial Metrics: Revenues, Margins, Growth Quarter Ended September Four diverse revenue streams providing a mix of YoY % of $ in thousands 2018 2017 transactional and annuity like revenue streams Growth Total Rev Revenue Product revenue grew 14%, with chillers gaining Cogeneration $ 1,664 $ 1,842 -9.7% 21.0% 89%, year over year Chiller 1,101 583 88.7% 13.9% Total Product Revenue 2,765 2,426 14.0% 34.8% Product gross margin improved 6% year over Service Contracts and Parts 2,066 2,110 -2.1% 26.0% Installation Services 1,648 2,410 -31.6% 20.8% year Total Service Revenue 3,714 4,519 -17.8% 46.8% Energy Production 1,460 1,556 -6.2% 18.4% Turnkey installation included in service Total Revenue $ 7,939 $ 8,501 -6.6% 100.0% operations facilitates both product and service Cost of Sales revenue Products $ 1,695 $ 1,539 10.2% Services 2,517 2,981 -15.6% Energy production revenue provided $1.5 Energy Production 843 723 16.6% million of stable cash flow with gross margin of Total Cost of Sales $ 5,056 $ 5,243 -3.6% 42.3%, exceeding expectations Gross Profit $ 2,883 $ 3,258 -11.5% 36.3% Net loss attributable to Tecogen Inc. $ (603) $ 27 Overall gross margin of 36.3%, down by 2% year over year Gross Margin Products 38.7% 36.6% Overall gross margin on a T4Q basis of 37.1% Services 32.2% 34.0% Aggregate Products and Services 35.0% 34.9% Total revenue growth on a T4Q basis of 23% Energy Production 42.3% 53.5% Overall 36.3% 38.3% 11
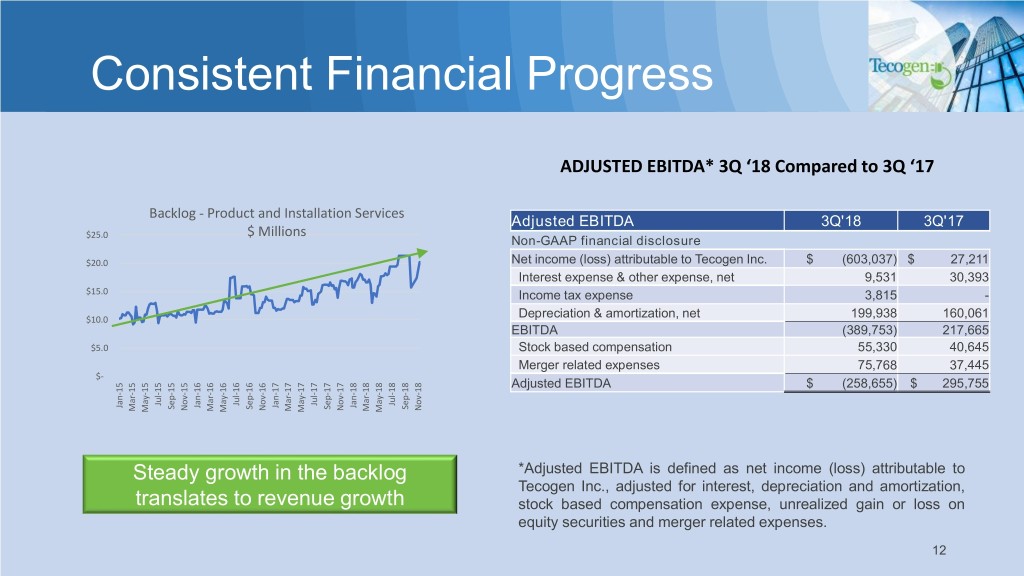
Consistent Financial Progress ADJUSTED EBITDA* 3Q ‘18 Compared to 3Q ‘17 Backlog - Product and Installation Services Adjusted EBITDA 3Q'18 3Q'17 $ Millions $25.0 Non-GAAP financial disclosure $20.0 Net income (loss) attributable to Tecogen Inc. $ (603,037) $ 27,211 Interest expense & other expense, net 9,531 30,393 $15.0 Income tax expense 3,815 - Depreciation & amortization, net 199,938 160,061 $10.0 EBITDA (389,753) 217,665 $5.0 Stock based compensation 55,330 40,645 Merger related expenses 75,768 37,445 $- Adjusted EBITDA $ (258,655) $ 295,755 Jul-15 Jul-16 Jul-17 Jul-18 Jan-15 Jan-16 Jan-17 Jan-18 Sep-15 Sep-16 Sep-17 Sep-18 Nov-15 Nov-16 Nov-17 Nov-18 Mar-15 Mar-16 Mar-17 Mar-18 May-15 May-16 May-17 May-18 Steady growth in the backlog *Adjusted EBITDA is defined as net income (loss) attributable to Tecogen Inc., adjusted for interest, depreciation and amortization, translates to revenue growth stock based compensation expense, unrealized gain or loss on equity securities and merger related expenses. 12
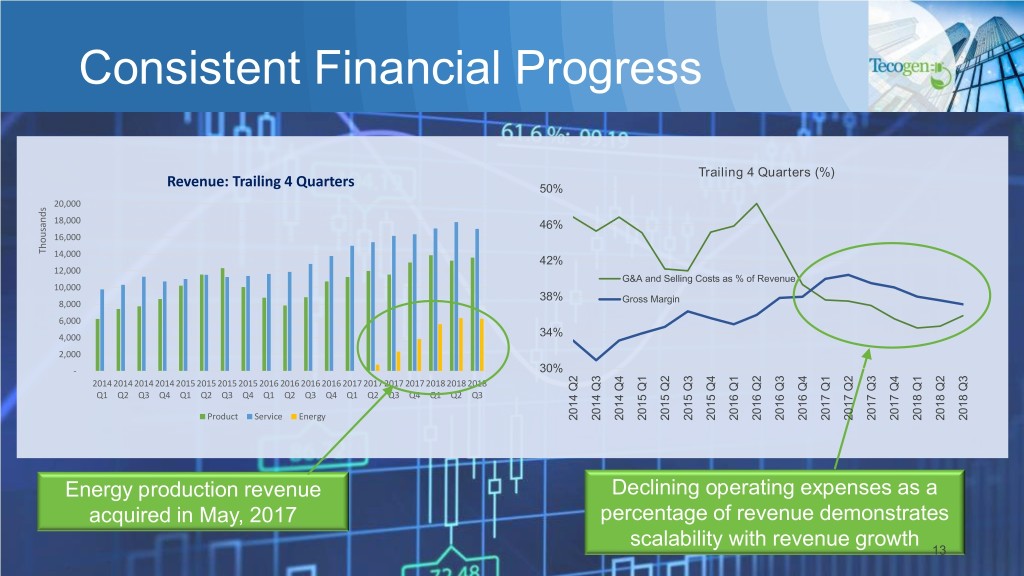
Consistent Financial Progress Trailing 4 Quarters (%) Revenue: Trailing 4 Quarters 50% 20,000 18,000 46% 16,000 Thousands 14,000 42% 12,000 G&A and Selling Costs as % of Revenue 10,000 38% Gross Margin 8,000 6,000 4,000 34% 2,000 - 30% 2014 2014 2014 2014 2015 2015 2015 2015 2016 2016 2016 2016 2017 2017 2017 2017 2018 2018 2018 Q1 Q2 Q3 Q4 Q1 Q2 Q3 Q4 Q1 Q2 Q3 Q4 Q1 Q2 Q3 Q4 Q1 Q2 Q3 2014 Q3 2014 Q4 2014 Q1 2015 Q2 2015 Q3 2015 Q4 2015 Q1 2016 Q2 2016 Q3 2016 Q4 2016 Q1 2017 Q2 2017 Q3 2017 Q4 2017 Q1 2018 Q2 2018 Q3 2018 Product Service Energy Q2 2014 Energy production revenue Declining operating expenses as a acquired in May, 2017 percentage of revenue demonstrates scalability with revenue growth 13
2018-19 Outlook Continue highlighting Tecogen systems as the most cost-effective, economically superior cogeneration technology Establish Tecogen’s gas engine cooling technology as the best alternative to costly electric cooling technology. Take advantage of additional utility revenue streams via “smart inverter” certification Develop testing and retrofit plan with Forklift Energy Efficiency Reimagined partner Initiate next phase of vehicle emissions project 14
Q&A Company Information Tecogen, Inc 45 First Ave Waltham, MA 02451 www.Tecogen.com Contact information Benjamin Locke, CEO 781.466.6402 Benjamin.Locke@Tecogen.com 15