OTCQX: TGEN FOURTH QUARTER & FISCAL 2020 YEAR END Earnings Call March 11, 2021
Participants 2 Chief Executive OfficerBenjamin Locke President & Chief Operating OfficerRobert Panora General Counsel & SecretaryJack Whiting
Safe Harbor Statement 3 This presentation and accompanying documents contain “forward-looking statements” which may describe strategies, goals, outlooks or other non- historical matters, or projected revenues, income, returns or other financial measures, that may include words such as "believe," "expect," "anticipate," "intend," "plan," "estimate," "project," "target," "potential," "will," "should," "could," "likely," or "may" and similar expressions intended to identify forward-looking statements. These statements are only predictions and involve known and unknown risks, uncertainties, and other factors that may cause our actual results to differ materially from those expressed or implied by such forward-looking statements. Given these uncertainties, you should not place undue reliance on these forward-looking statements. Forward-looking statements speak only as of the date on which they are made, and we undertake no obligation to update or revise any forward-looking statements. In addition to those factors described in our Annual Report on Form 10-K and our Quarterly Reports on Form 10-Q under “Risk Factors”, among the factors that could cause actual results to differ materially from past and projected future results are the following: fluctuations in demand for our products and services, competing technological developments, issues relating to research and development, the availability of incentives, rebates, and tax benefits relating to our products and services, changes in the regulatory environment relating to our products and services, integration of acquired business operations, and the ability to obtain financing on favorable terms to fund existing operations and anticipated growth. In addition to GAAP financial measures, this presentation includes certain non-GAAP financial measures, including adjusted EBITDA which excludes certain expenses as described in the presentation. We use Adjusted EBITDA as an internal measure of business operating performance and believe that the presentation of non-GAAP financial measures provides a meaningful perspective of the underlying operating performance of our current business and enables investors to better understand and evaluate our historical and prospective operating performance by eliminating items that vary from period to period without correlation to our core operating performance and highlights trends in our business that may not otherwise be apparent when relying solely on GAAP financial measures.
Earnings Call Agenda Agenda: Tecogen Overview Key Takeaways Q4 and 2020 Results Ultera Emissions Update Final Comments Q&A 4
Leader in Distributed Generation Technology • Unmatched efficiency of air-conditioning and cooling systems • Ultera technology ensures emissions compliance in most stringent US districts • Enable black-start and off-grid power generation • Ranked 3rd in quantity of microgrids deployed in US Positioned For Low Carbon Future • High efficiency enables significant carbon reductions compared to heating and cooling systems dependent on grid Proprietary Ultera Emissions Technology • Demonstrated success across range of engine brands and sizes • Considering options to expand commercialization Clean and Efficient Energy Systems Tecogen Overview 5
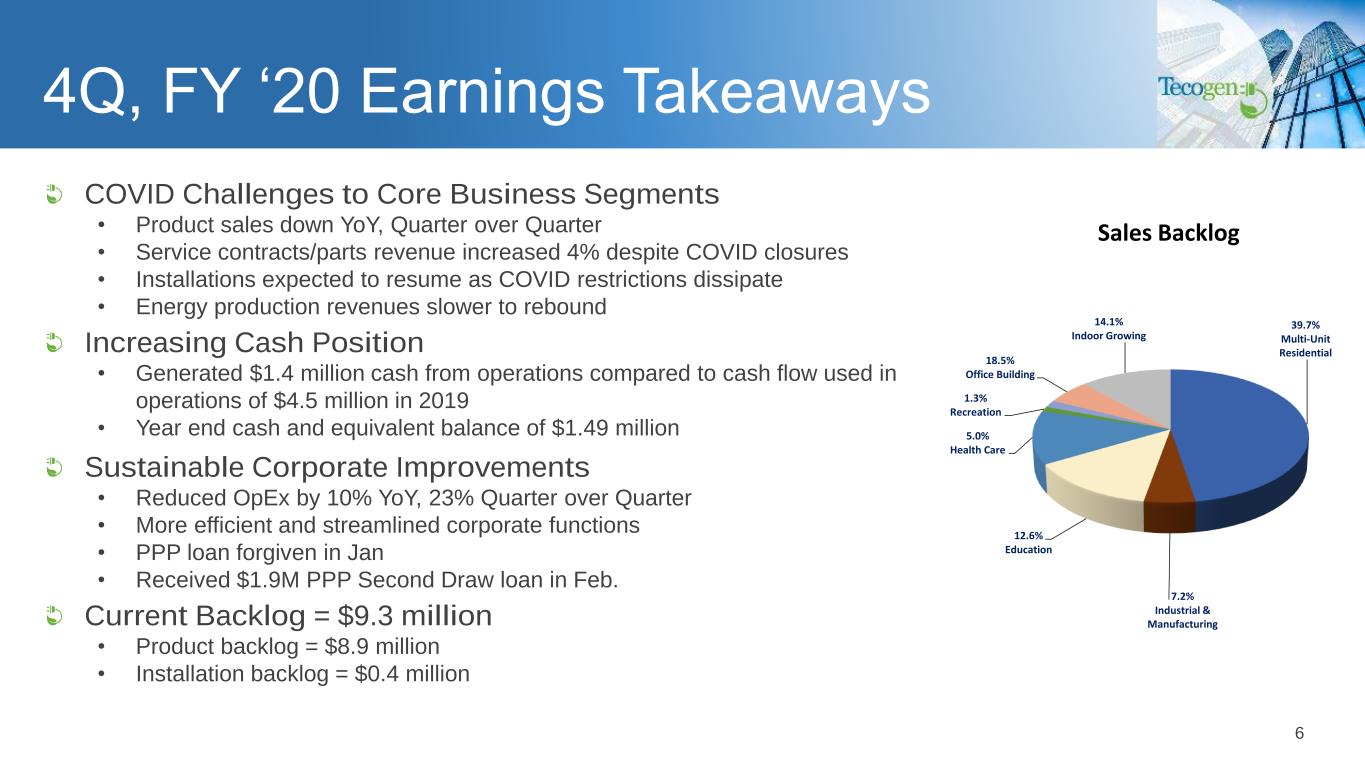
39.7% Multi-Unit Residential 7.2% Industrial & Manufacturing 12.6% Education 5.0% Health Care 1.3% Recreation 18.5% Office Building 14.1% Indoor Growing Customer Segment 6 4Q, FY ‘20 Earnings Takeaways COVID Challenges to Core Business Segments • Product sales down YoY, Quarter over Quarter • Service contracts/parts revenue increased 4% despite COVID closures • Installations expected to resume as COVID restrictions dissipate • Energy production revenues slower to rebound Increasing Cash Position • Generated $1.4 million cash from operations compared to cash flow used in operations of $4.5 million in 2019 • Year end cash and equivalent balance of $1.49 million Sustainable Corporate Improvements • Reduced OpEx by 10% YoY, 23% Quarter over Quarter • More efficient and streamlined corporate functions • PPP loan forgiven in Jan • Received $1.9M PPP Second Draw loan in Feb. Current Backlog = $9.3 million • Product backlog = $8.9 million • Installation backlog = $0.4 million Sales Backlog
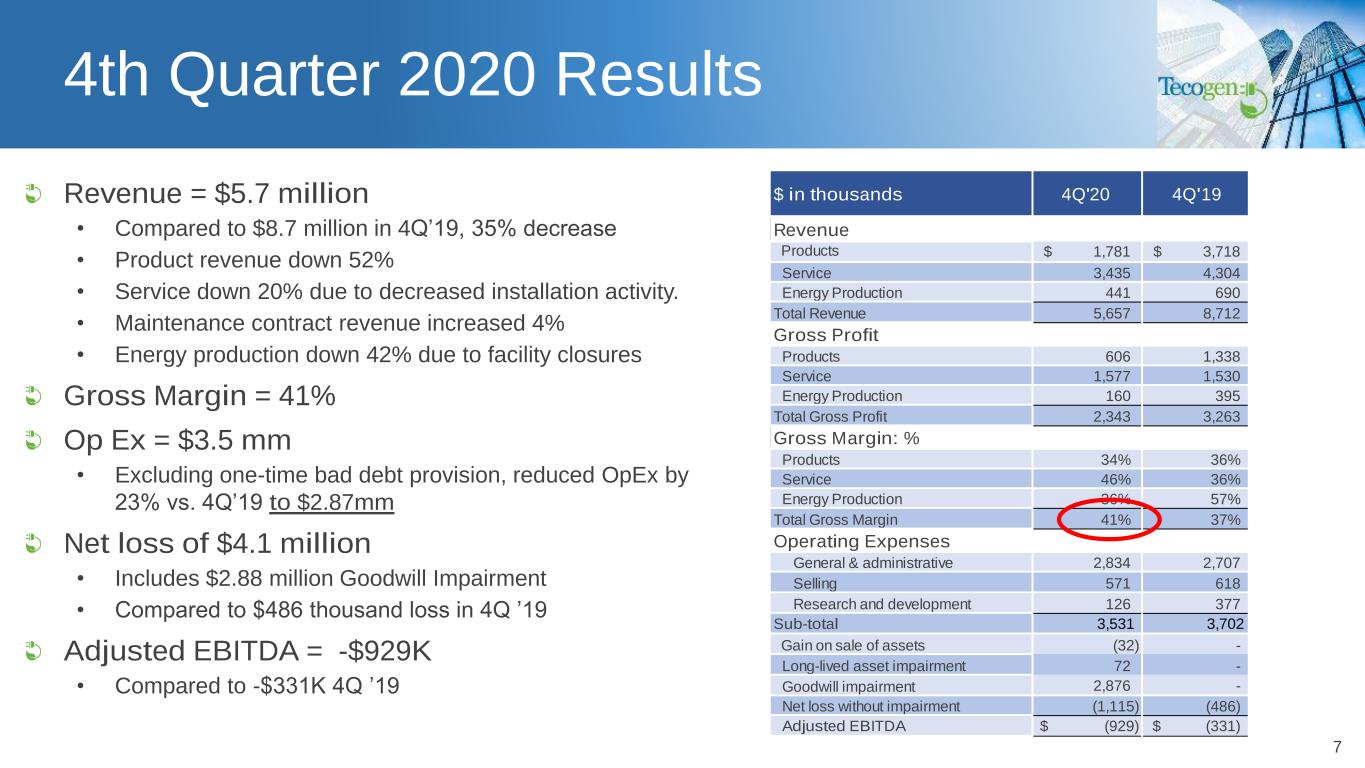
4th Quarter 2020 Results 7 Revenue = $5.7 million • Compared to $8.7 million in 4Q’19, 35% decrease • Product revenue down 52% • Service down 20% due to decreased installation activity. • Maintenance contract revenue increased 4% • Energy production down 42% due to facility closures Gross Margin = 41% Op Ex = $3.5 mm • Excluding one-time bad debt provision, reduced OpEx by 23% vs. 4Q’19 to $2.87mm Net loss of $4.1 million • Includes $2.88 million Goodwill Impairment • Compared to $486 thousand loss in 4Q ’19 Adjusted EBITDA = -$929K • Compared to -$331K 4Q ’19 $ in thousands 4Q'20 4Q'19 YoY Change % Chg Revenue Products $ 1,781 $ 3,718 $ (1,937) Service 3,435 4,304 (869) Energy Production 441 690 (249) Total Revenue 5,657 8,712 (3,055) -35.1% Gross Profit Products 606 1,338 (732) Service 1,577 1,530 47 Energy Production 160 395 (235) Total Gross Profit 2,343 3,263 (920) -31.9% Gross Margin: % Products 34% 36% -2% Service 46% 36% 10% Energy Production 36% 57% -21% Total Gross Margin 41% 37% 4% 4.0% Operating Expenses General & administrative 2,834 2,707 127 Selling 571 618 (47) Research and development 126 377 (251) Sub-total 3,531 3,702 (171) -0.3% Gain on sale of assets (32) - (32) Long-lived asset impairment 72 - - Goodwill impairment 2,876 - 2,876 Net loss without impairment (1,115) (486) (629) Adjusted EBITDA $ (929) $ (331) $ (598)
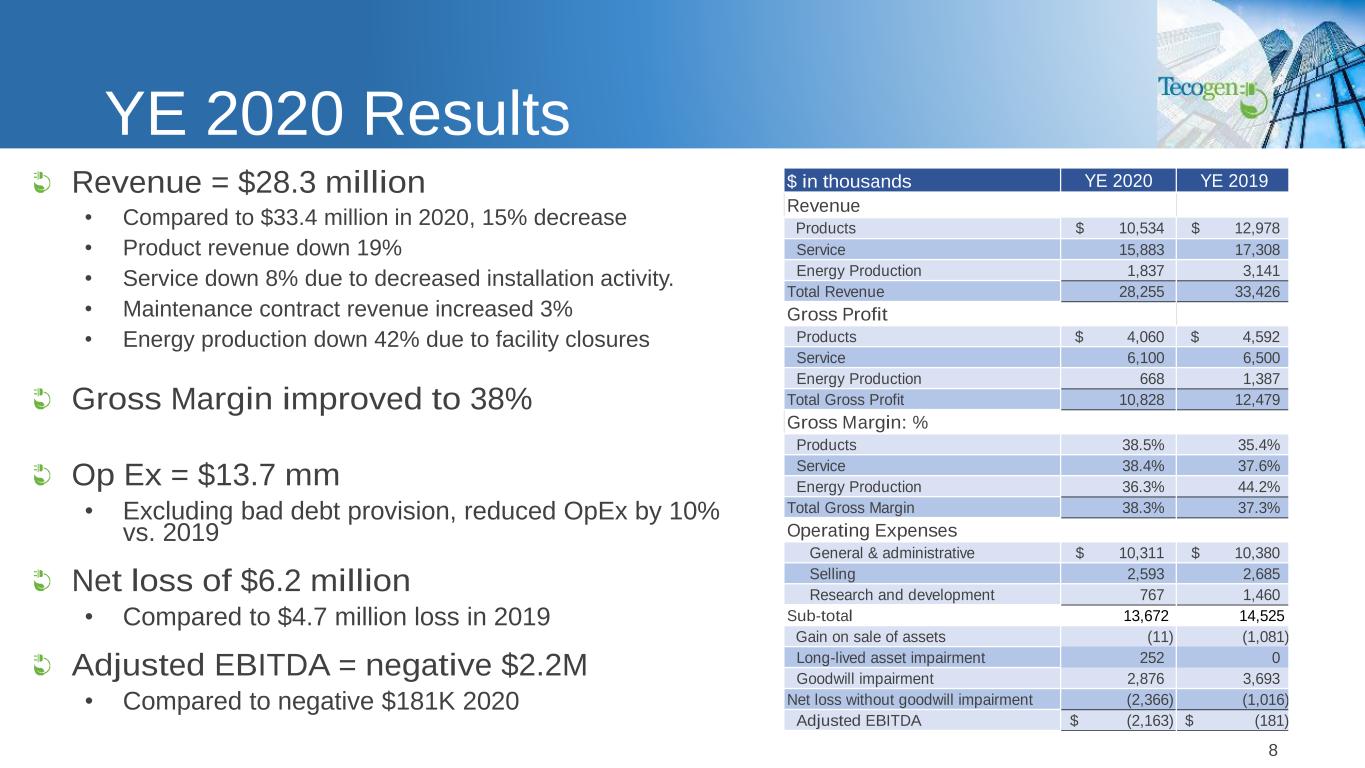
YE 2020 Results Revenue = $28.3 million • Compared to $33.4 million in 2020, 15% decrease • Product revenue down 19% • Service down 8% due to decreased installation activity. • Maintenance contract revenue increased 3% • Energy production down 42% due to facility closures Gross Margin improved to 38% Op Ex = $13.7 mm • Excluding bad debt provision, reduced OpEx by 10% vs. 2019 Net loss of $6.2 million • Compared to $4.7 million loss in 2019 Adjusted EBITDA = negative $2.2M • Compared to negative $181K 2020 8 $ in thousands YE 2020 YE 2019 Revenue Products $ 10,534 $ 12,978 $ (2,444) Service 15,883 17,308 (1,424) Energy Production 1,837 3,141 (1,304) Total Revenue 28,255 33,426 (5,172) -15.5% Gross Profit Products $ 4,060 $ 4,592 $ (532) Service 6,100 6,500 (400) Energy Production 668 1,387 (719) Total Gross Profit 10,828 12,479 (1,651) -13.2% Gross Margin: % Products 38.5% 35.4% 3% Service 38.4% 37.6% 1% Energy Production 36.3% 44.2% -8% Total Gross Margin 38.3% 37.3% 1% Operating Expenses General & administrative $ 10,311 $ 10,380 $ (69) Selling 2,593 2,685 (92) Research and development 767 1,460 (693) Sub-total 13,672 14,525 (854) -5.9% Gain on sale of assets (11) (1,081) 1,070 Long-lived asset impairment 252 0 252 Goodwill impairment 2,876 3,693 (817) Net loss without goodwill impairment (2,366) (1,016) (1,350) Adjusted EBITDA (2,163)$ $ (181) $ (1,982) YoY Change
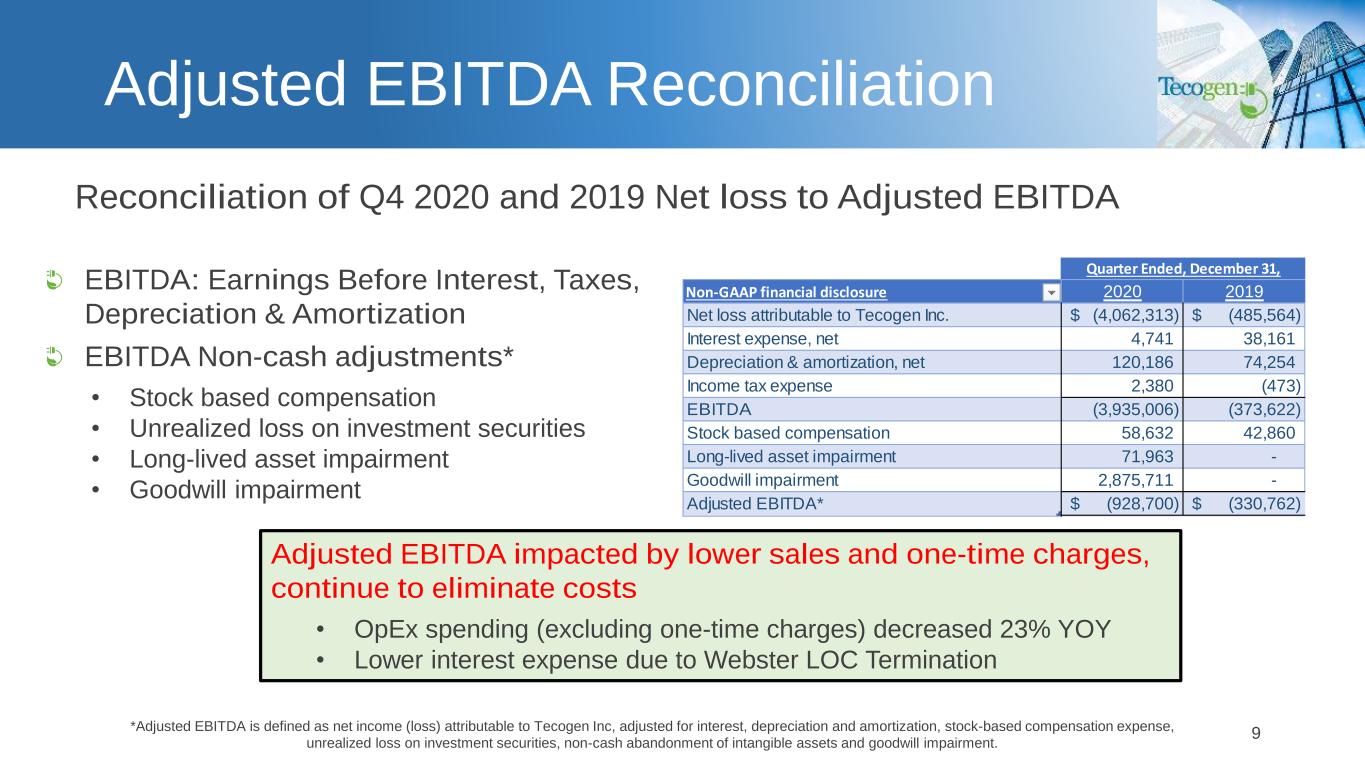
Adjusted EBITDA Reconciliation 9 Reconciliation of Q4 2020 and 2019 Net loss to Adjusted EBITDA EBITDA: Earnings Before Interest, Taxes, Depreciation & Amortization EBITDA Non-cash adjustments* • Stock based compensation • Unrealized loss on investment securities • Long-lived asset impairment • Goodwill impairment Adjusted EBITDA impacted by lower sales and one-time charges, continue to eliminate costs • OpEx spending (excluding one-time charges) decreased 23% YOY • Lower interest expense due to Webster LOC Termination Non-GAAP financial disclosure 2020 2019 Net loss attributable to Tecogen Inc. (4,062,313)$ (485,564)$ Interest expense, net 4,741 38,161 Depreciation & amortization, net 120,186 74,254 Income tax expense 2,380 (473) EBITDA (3,935,006) (373,622) Stock based compensation 58,632 42,860 Long-lived asset impairment 71,963 - Goodwill impairment 2,875,711 - Adjusted EBITDA* (928,700)$ (330,762)$ Quarter Ended, December 31, *Adjusted EBITDA is defined as net income (loss) attributable to Tecogen Inc, adjusted for interest, depreciation and amortization, stock-based compensation expense, unrealized loss on investment securities, non-cash abandonment of intangible assets and goodwill impairment.
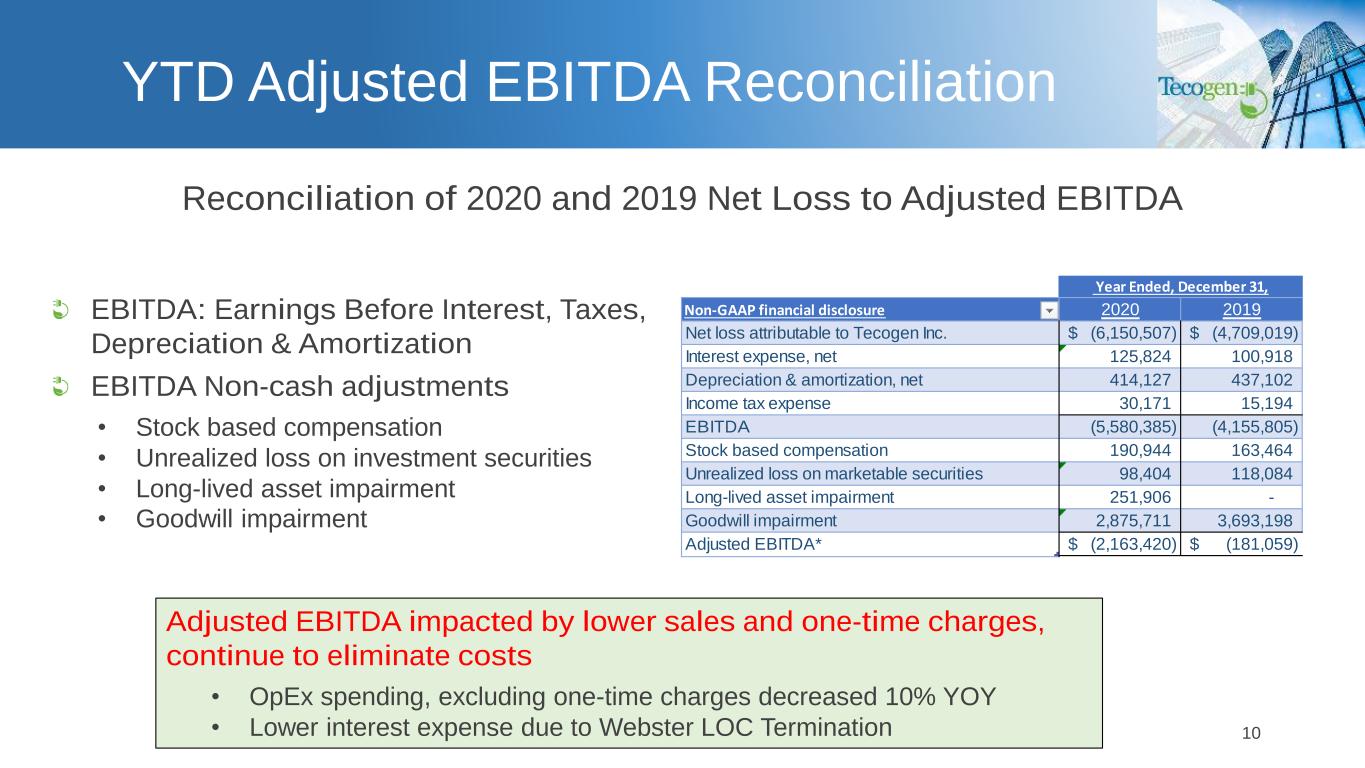
YTD Adjusted EBITDA Reconciliation 10 Reconciliation of 2020 and 2019 Net Loss to Adjusted EBITDA EBITDA: Earnings Before Interest, Taxes, Depreciation & Amortization EBITDA Non-cash adjustments • Stock based compensation • Unrealized loss on investment securities • Long-lived asset impairment • Goodwill impairment Adjusted EBITDA impacted by lower sales and one-time charges, continue to eliminate costs • OpEx spending, excluding one-time charges decreased 10% YOY • Lower interest expense due to Webster LOC Termination Non-GAAP financial disclosure 2020 2019 Net loss attributable to Tecogen Inc. (6,150,507)$ (4,709,019)$ Interest expense, net 125,824 100,918 Depreciation & amortization, net 414,127 437,102 Income tax expense 30,171 15,194 EBITDA (5,580,385) (4,155,805) Stock based compensation 190,944 163,464 Unrealized loss on marketable securities 98,404 118,084 Long-lived asset impairment 251,906 - Goodwill impairment 2,875,711 3,693,198 Adjusted EBITDA* (2,163,420)$ (181,059)$ Year Ended, December 31,
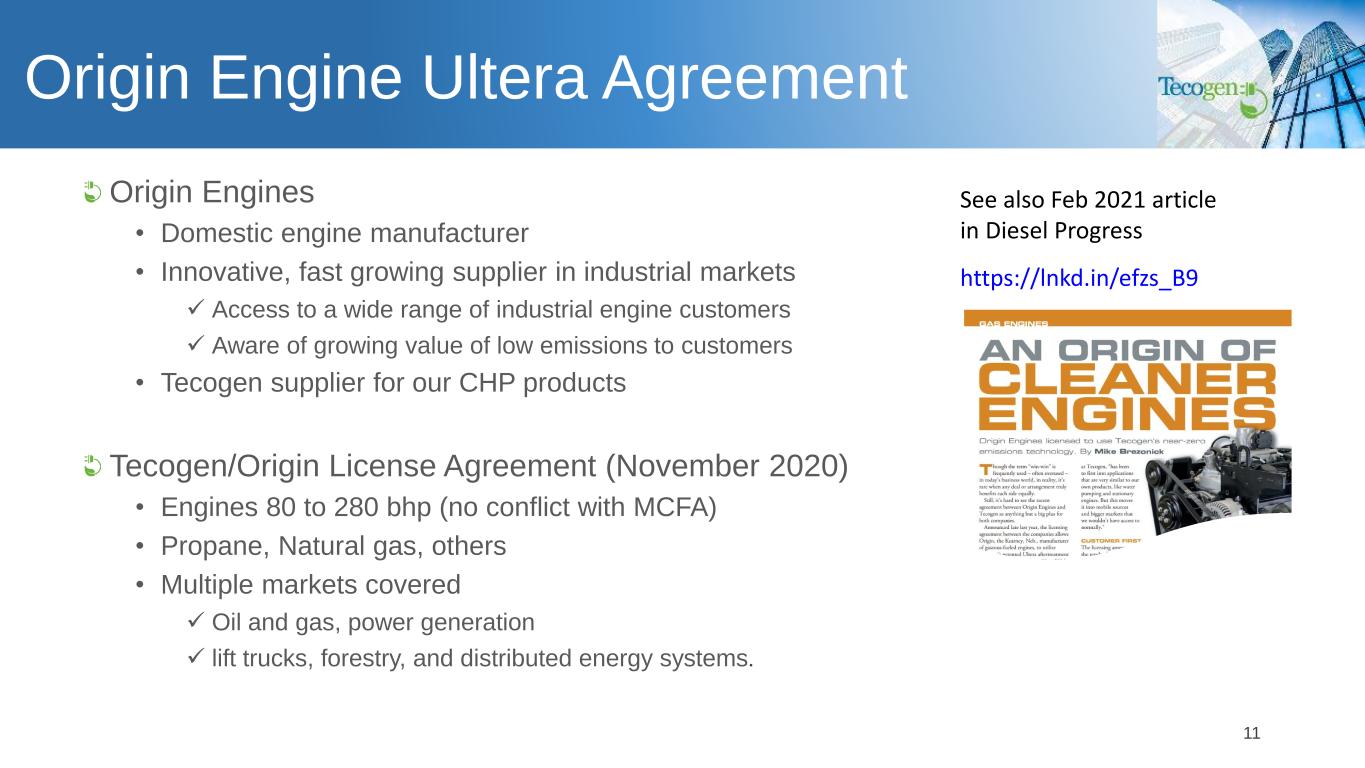
Origin Engine Ultera Agreement Origin Engines • Domestic engine manufacturer • Innovative, fast growing supplier in industrial markets ✓ Access to a wide range of industrial engine customers ✓ Aware of growing value of low emissions to customers • Tecogen supplier for our CHP products Tecogen/Origin License Agreement (November 2020) • Engines 80 to 280 bhp (no conflict with MCFA) • Propane, Natural gas, others • Multiple markets covered ✓ Oil and gas, power generation ✓ lift trucks, forestry, and distributed energy systems. 11 See also Feb 2021 article in Diesel Progress https://lnkd.in/efzs_B9
Ultera Emissions Update MCFA program - now Mitsubishi Logisnext Americas Inc. (MLA) • Remains on hold Origin agreement very positive outlook • Strong potential to expand Ultera ✓ Other lift manufacturers and other markets • Aggressive schedule for implementation Ongoing catalyst research • Third party contracted by Tecogen to investigate improved second stage formulations • Opportunity for innovation because of low temp environment • Laboratory testing has identified more active formulation • Important to pursue ✓ Patentable ✓ Tangible component of Ultera that could become Tecogen product ✓ Potential for lower cost 12
Final Comments 2021 annual OpEx expected <$12 million, $2.5 million improvement over 2019 Cash position strengthened by improved cash management, PPP funds Product focus on resiliency becoming more widely embraced GHG reduction benefits of all Tecogen systems an important factor in driving new sales Agreement with Origin expands potential commercial applications for Ultera 13
Q&A Company Information Tecogen, Inc 45 First Ave Waltham, MA 02451 www.Tecogen.com Contact information Benjamin Locke, CEO 781.466.6402 Benjamin.Locke@Tecogen.com 14