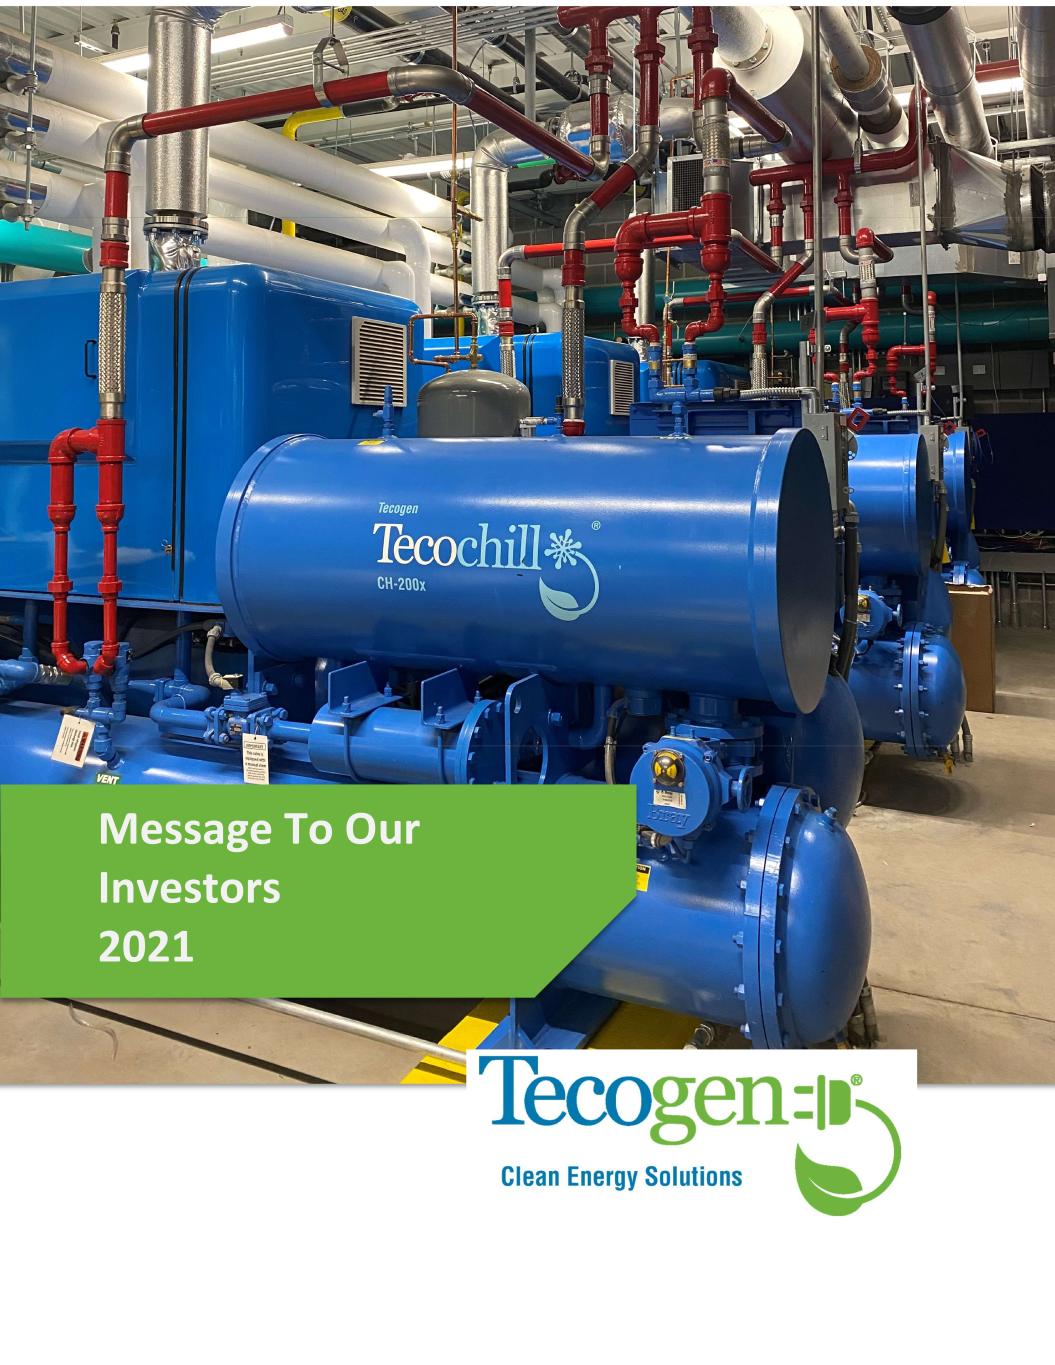
Message To Our Investors 2021
SAFE HARBOR STATEMENT This presentation and accompanying documents contain “forward-looking statements” which may describe strategies, goals, outlooks or other non-historical matters, or projected revenues, Income, returns or other financial measures, that may include words such as "believe," "expect," "anticipate," "intend," "plan," "estimate," "project," "target," "potential," "will," "should," "could," "likely," or "may" and similar expressions intended to identify forward-looking statements. These statements are only predictions and involve known and unknown risks, uncertainties, and other factors that may cause our actual results to differ materially from those expressed or implied by such forward-looking statements. Given these uncertainties, you should not place undue reliance on these forward- looking statements. Forward-looking statements speak only as of the date on which they are made, and we undertake no obligation to update or revise any forward-looking statements. In addition to those factors described in our Annual Report on Form 10-K and our Quarterly Reports on Form 10-Q under “Risk Factors”, among the factors that could cause actual results to differ materially from past and projected future results are the following: fluctuations in demand for our products and services, competing technological developments, issues relating to research and development, the availability of incentives, rebates, and tax benefits relating to our products and services, changes in the regulatory environment relating to our products and services, integration of acquired business operations, and the ability to obtain financing on favorable terms to fund existing operations and anticipated growth. In addition to GAAP financial measures, this document includes certain non-GAAP financial measures, including adjusted EBITDA which excludes certain expenses as described in the presentation. We use Adjusted EBITDA as an internal measure of business operating performance and believe that the presentation of non-GAAP financial measures provides a meaningful perspective of the underlying operating performance of our current business and enables investors to better understand and evaluate our historical and prospective operating performance by eliminating items that vary from period to period without correlation to our core operating performance and highlights trends in our business that may not otherwise be apparent when relying solely on GAAP financial measures.
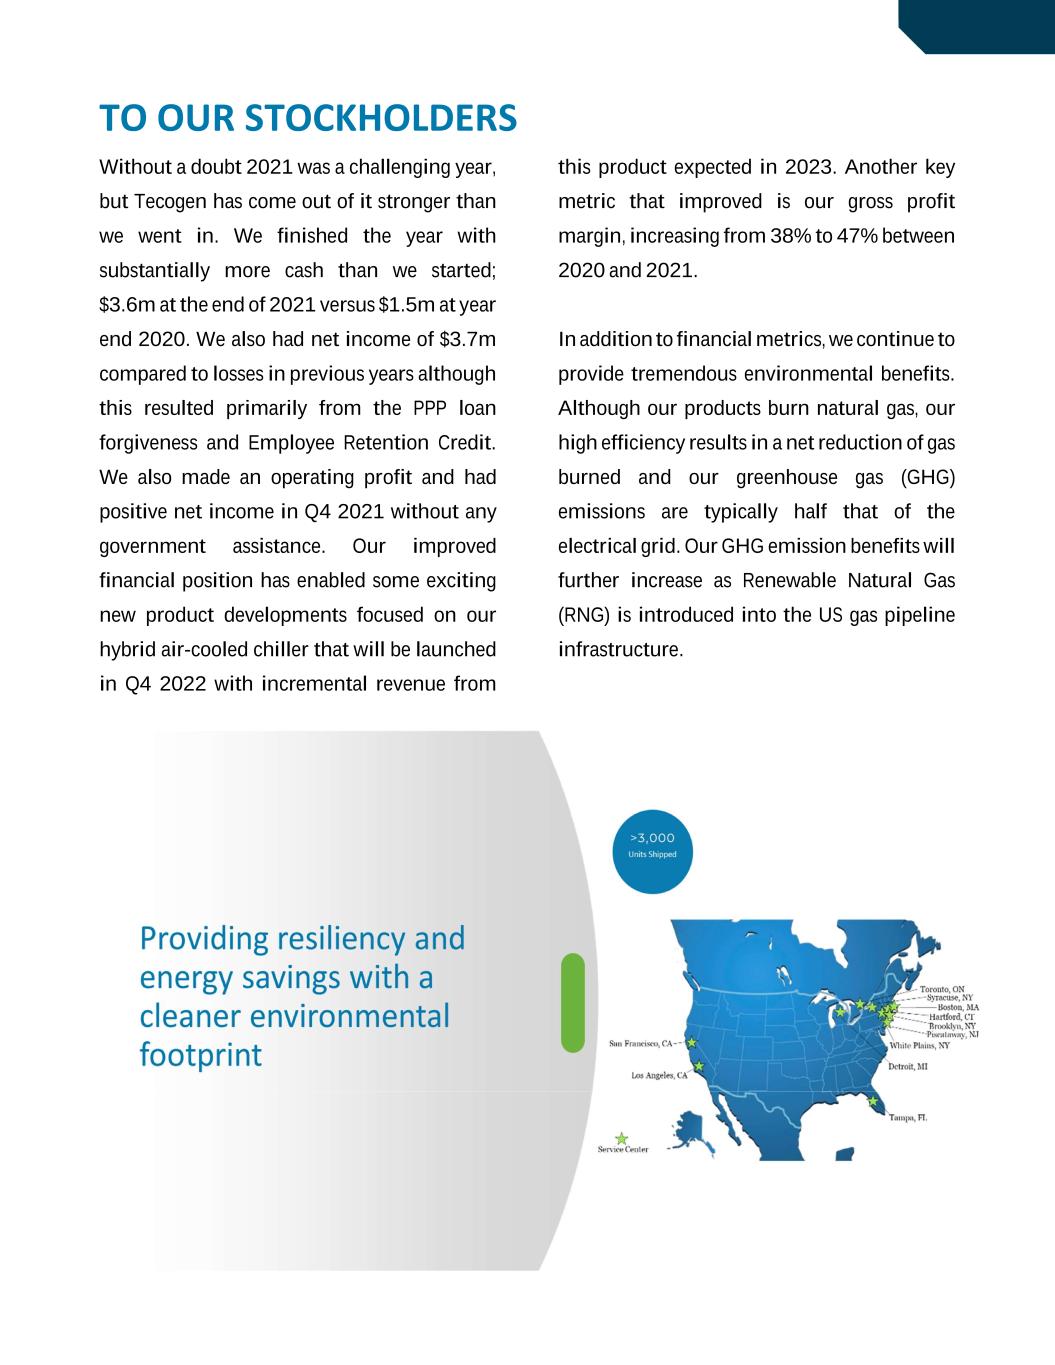
TO OUR STOCKHOLDERS Without a doubt 2021 was a challenging year, but Tecogen has come out of it stronger than we went in. We finished the year with substantially more cash than we started; $3.6m at the end of 2021 versus $1.5m at year end 2020. We also had net income of $3.7m compared to losses in previous years although this resulted primarily from the PPP loan forgiveness and Employee Retention Credit. We also made an operating profit and had positive net income in Q4 2021 without any government assistance. Our improved financial position has enabled some exciting new product developments focused on our hybrid air-cooled chiller that will be launched in Q4 2022 with incremental revenue from this product expected in 2023. Another key metric that improved is our gross profit margin, increasing from 38% to 47% between 2020 and 2021. In addition to financial metrics, we continue to provide tremendous environmental benefits. Although our products burn natural gas, our high efficiency results in a net reduction of gas burned and our greenhouse gas (GHG) emissions are typically half that of the electrical grid. Our GHG emission benefits will further increase as Renewable Natural Gas (RNG) is introduced into the US gas pipeline infrastructure.
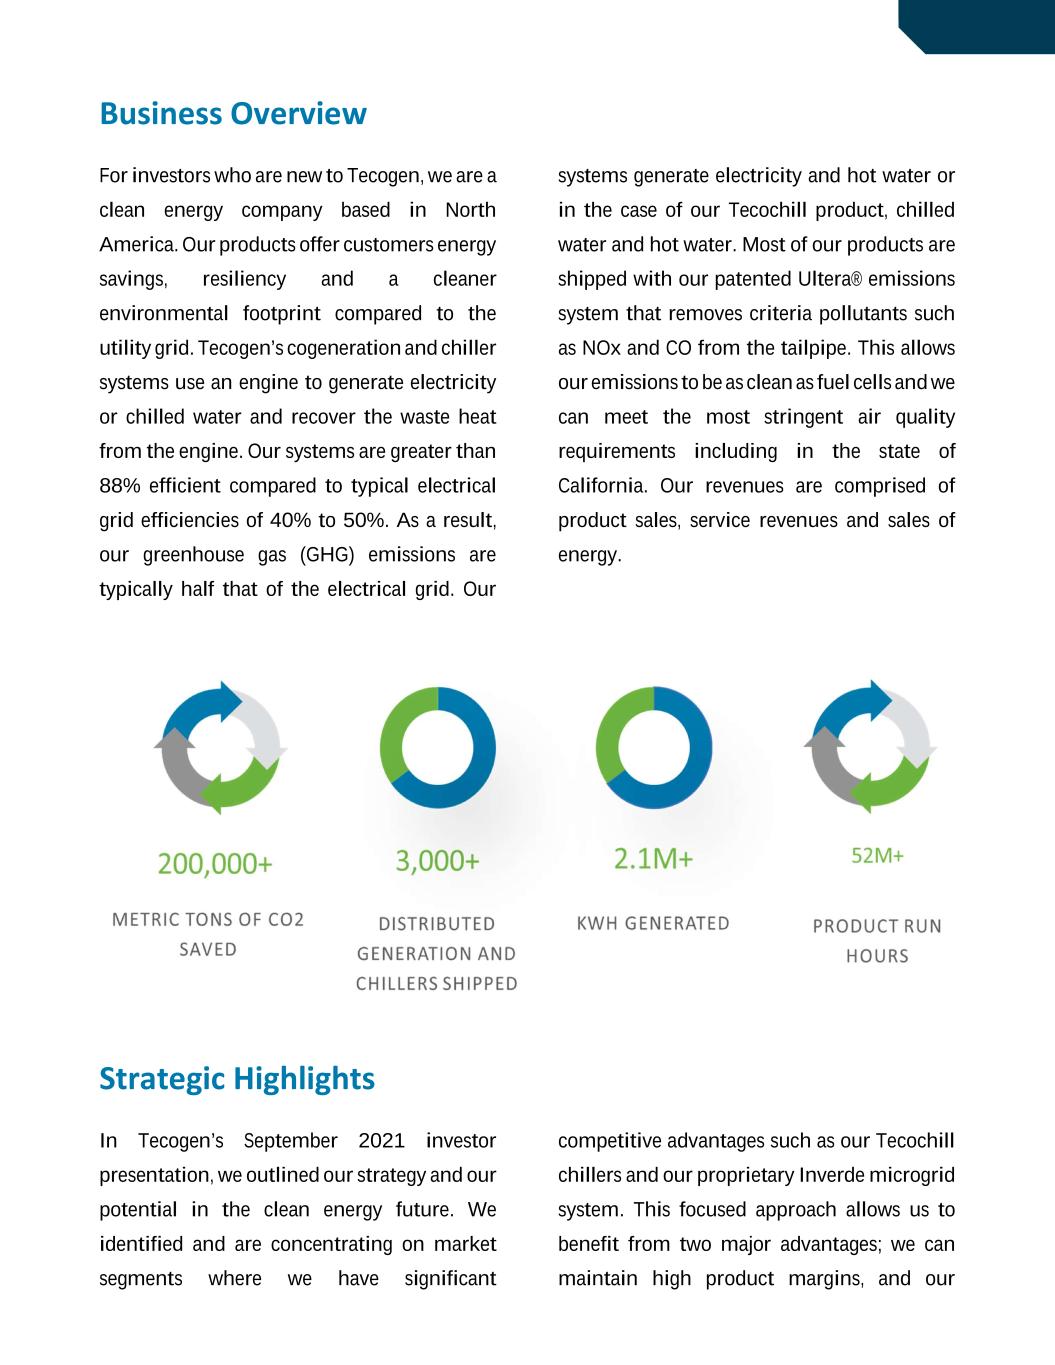
Business Overview For investors who are new to Tecogen, we are a clean energy company based in North America. Our products offer customers energy savings, resiliency and a cleaner environmental footprint compared to the utility grid. Tecogen’s cogeneration and chiller systems use an engine to generate electricity or chilled water and recover the waste heat from the engine. Our systems are greater than 88% efficient compared to typical electrical grid efficiencies of 40% to 50%. As a result, our greenhouse gas (GHG) emissions are typically half that of the electrical grid. Our systems generate electricity and hot water or in the case of our Tecochill product, chilled water and hot water. Most of our products are shipped with our patented Ultera® emissions system that removes criteria pollutants such as NOx and CO from the tailpipe. This allows our emissions to be as clean as fuel cells and we can meet the most stringent air quality requirements including in the state of California. Our revenues are comprised of product sales, service revenues and sales of energy. Strategic Highlights In Tecogen’s September 2021 investor presentation, we outlined our strategy and our potential in the clean energy future. We identified and are concentrating on market segments where we have significant competitive advantages such as our Tecochill chillers and our proprietary Inverde microgrid system. This focused approach allows us to benefit from two major advantages; we can maintain high product margins, and our
products are more economically compelling for channel partners, thereby increasing our sales reach. The customer profile where we have the largest advantage is a facility that has a simultaneous need for cooling and dehumidification, or cooling and heat. Some key customer segments include controlled environment agriculture (including cannabis cultivation), healthcare, ice rinks, food processing, and certain other process cooling customers. Our Tecochill product is ideally suited to these customers as we offer substantial economic savings, lower greenhouse gas emissions and better humidity control compared to traditional electric cooling technologies. In addition, we believe that the Tecochill benefits from significant barriers to entry for new entrants who would need many years of R&D to replicate our system and a strong service network to provide the uptime that these process cooling customers require. We plan to expand our market share for clean cooling in 2022 through our existing products and in 2023 through the introduction of our hybrid air cooled chiller which we believe will benefit from pending patents for the hybrid drive. In 2022 we will also introduce the air-cooled chiller to existing customers and within the engineering community. Our target is for air- cooled chiller sales by early 2023. Market Highlights In the process cooling segment, our primary focus in 2021 was in the cannabis market as we believe this is one of the largest and fastest growing market opportunities for our technology and believe this growth will continue into 2022 and beyond. Each new cannabis facility represents potential revenue of >$1m for Tecogen. There are more than 100 state-specific cannabis license applications that are pending as well as retrofits of existing active licenses that represent a market potential to Tecogen of greater than $150m over the next 3-5 years in key states such as Massachusetts, New York, New Jersey, Florida, and other states as they expand recreational marijuana production.
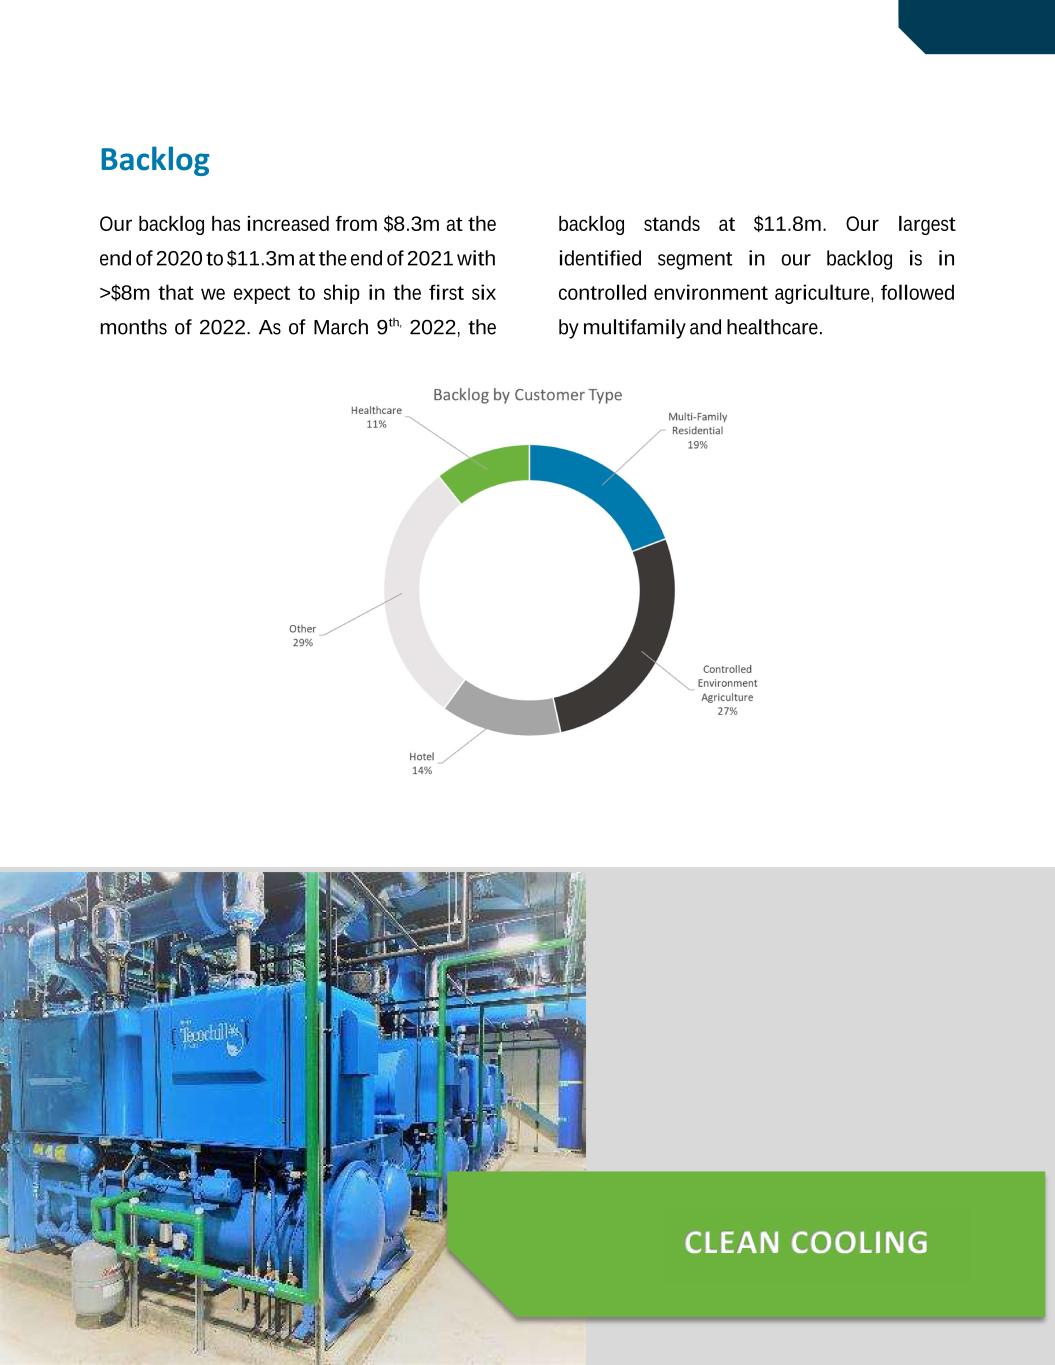
Backlog Our backlog has increased from $8.3m at the end of 2020 to $11.3m at the end of 2021 with >$8m that we expect to ship in the first six months of 2022. As of March 9th, 2022, the backlog stands at $11.8m. Our largest identified segment in our backlog is in controlled environment agriculture, followed by multifamily and healthcare. CLEAN COOLING
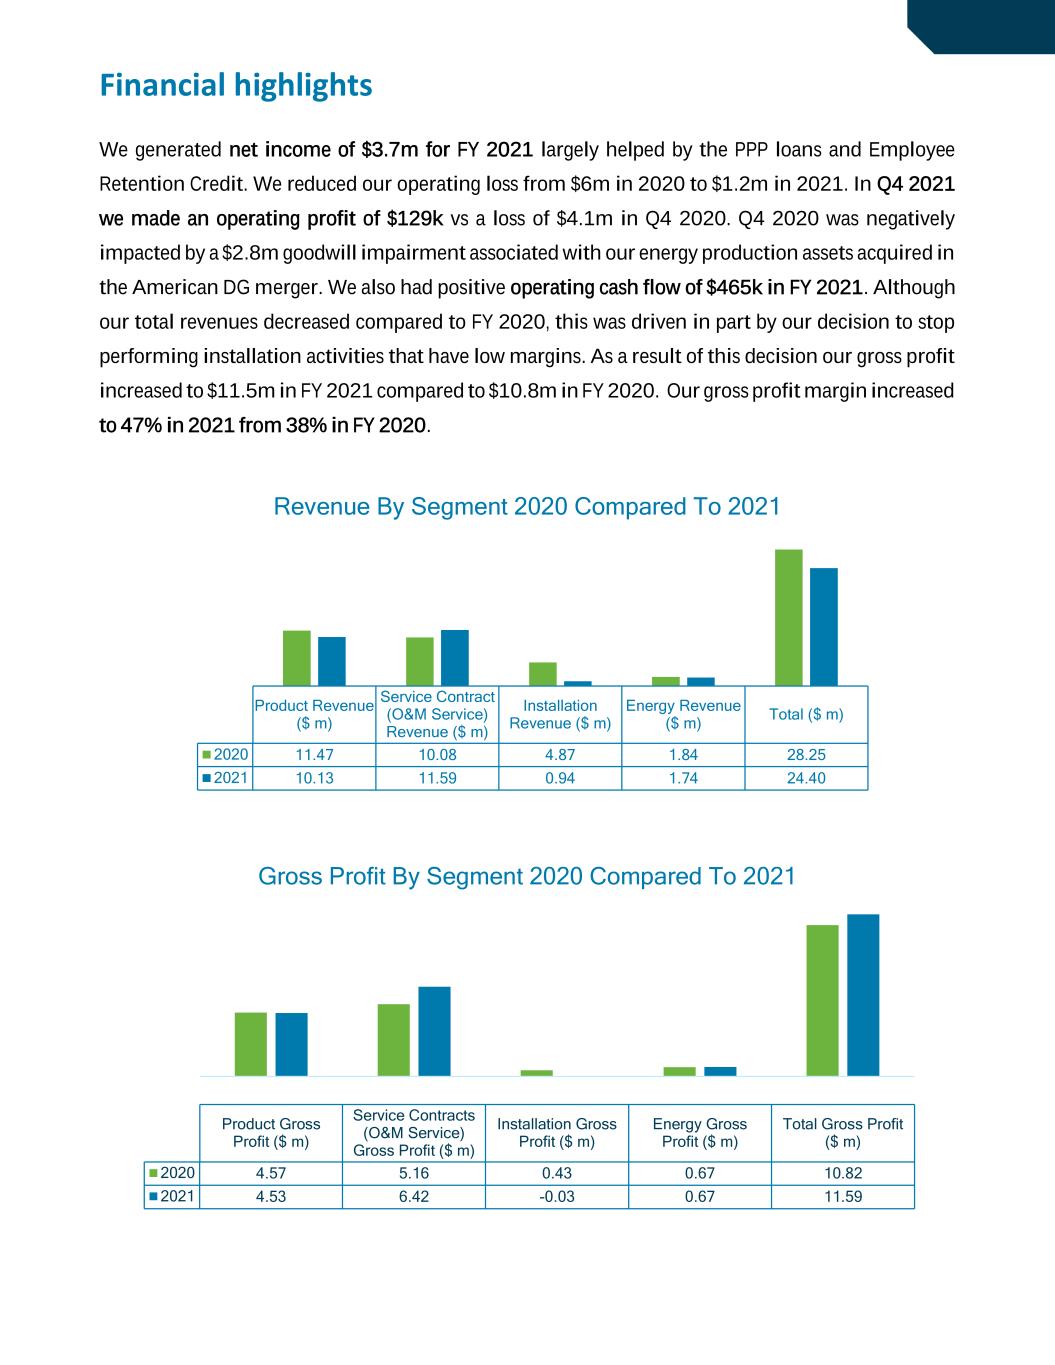
Financial highlights We generated net income of $3.7m for FY 2021 largely helped by the PPP loans and Employee Retention Credit. We reduced our operating loss from $6m in 2020 to $1.2m in 2021. In Q4 2021 we made an operating profit of $129k vs a loss of $4.1m in Q4 2020. Q4 2020 was negatively impacted by a $2.8m goodwill impairment associated with our energy production assets acquired in the American DG merger. We also had positive operating cash flow of $465k in FY 2021. Although our total revenues decreased compared to FY 2020, this was driven in part by our decision to stop performing installation activities that have low margins. As a result of this decision our gross profit increased to $11.5m in FY 2021 compared to $10.8m in FY 2020. Our gross profit margin increased to 47% in 2021 from 38% in FY 2020. Product Revenue ($ m) Service Contract (O&M Service) Revenue ($ m) Installation Revenue ($ m) Energy Revenue ($ m) Total ($ m) 2020 11.47 10.08 4.87 1.84 28.25 2021 10.13 11.59 0.94 1.74 24.40 Revenue By Segment 2020 Compared To 2021 Product Gross Profit ($ m) Service Contracts (O&M Service) Gross Profit ($ m) Installation Gross Profit ($ m) Energy Gross Profit ($ m) Total Gross Profit ($ m) 2020 4.57 5.16 0.43 0.67 10.82 2021 4.53 6.42 -0.03 0.67 11.59 Gross Profit By Segment 2020 Compared To 2021
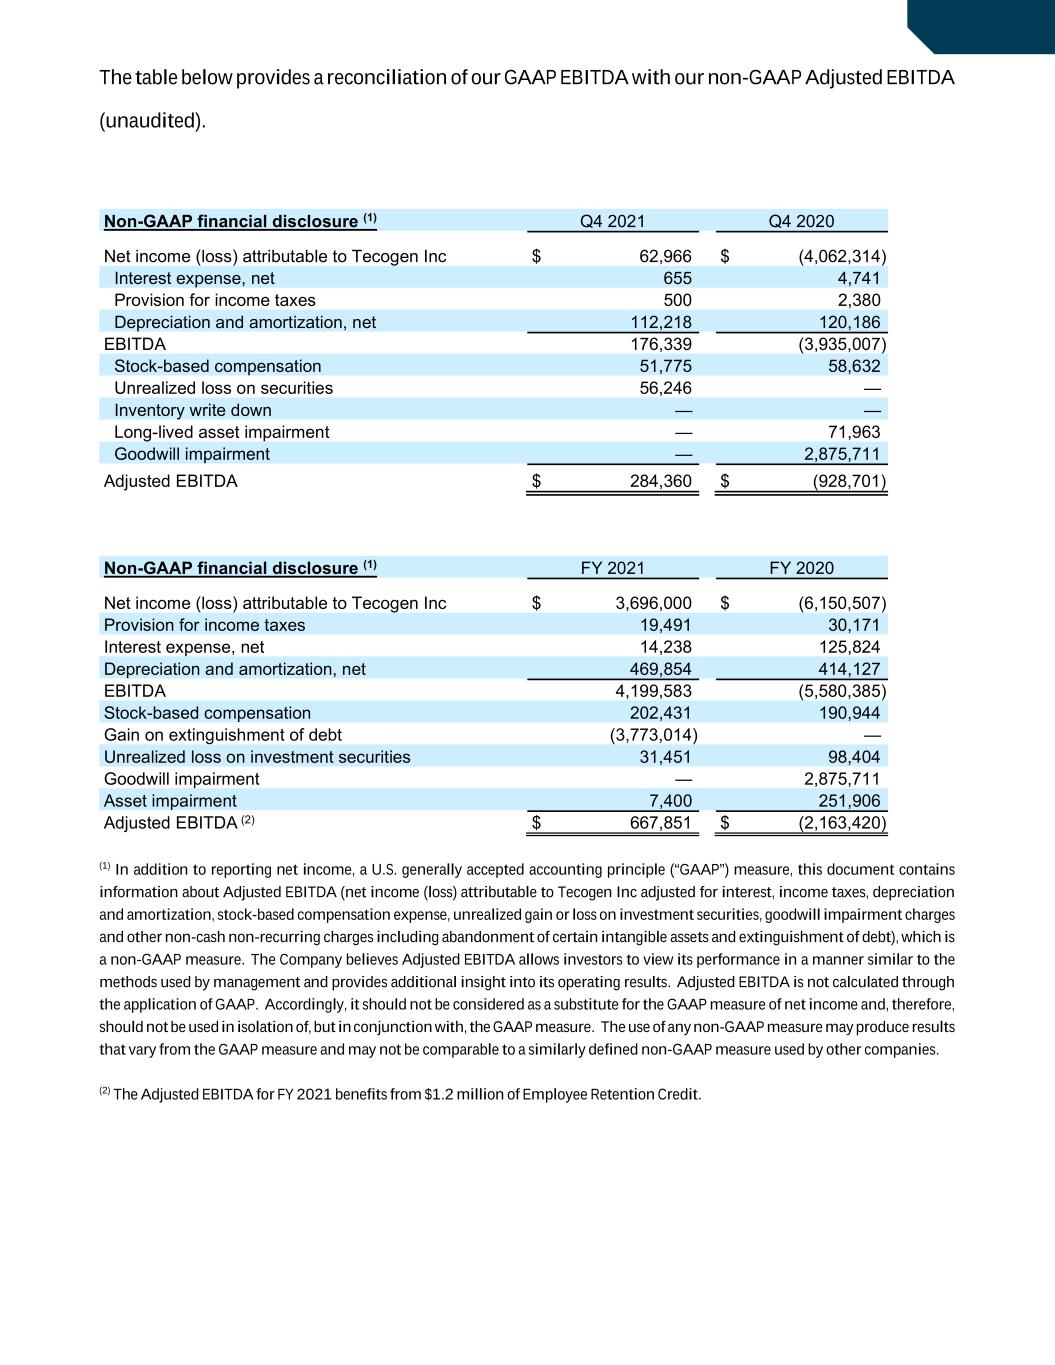
The table below provides a reconciliation of our GAAP EBITDA with our non-GAAP Adjusted EBITDA (unaudited). Non-GAAP financial disclosure (1) Q4 2021 Q4 2020 Net income (loss) attributable to Tecogen Inc $ 62,966 $ (4,062,314) Interest expense, net 655 4,741 Provision for income taxes 500 2,380 Depreciation and amortization, net 112,218 120,186 EBITDA 176,339 (3,935,007) Stock-based compensation 51,775 58,632 Unrealized loss on securities 56,246 — Inventory write down — — Long-lived asset impairment — 71,963 Goodwill impairment — 2,875,711 Adjusted EBITDA $ 284,360 $ (928,701) Non-GAAP financial disclosure (1) FY 2021 FY 2020 Net income (loss) attributable to Tecogen Inc $ 3,696,000 $ (6,150,507) Provision for income taxes 19,491 30,171 Interest expense, net 14,238 125,824 Depreciation and amortization, net 469,854 414,127 EBITDA 4,199,583 (5,580,385) Stock-based compensation 202,431 190,944 Gain on extinguishment of debt (3,773,014) — Unrealized loss on investment securities 31,451 98,404 Goodwill impairment — 2,875,711 Asset impairment 7,400 251,906 Adjusted EBITDA (2) $ 667,851 $ (2,163,420) (1) In addition to reporting net income, a U.S. generally accepted accounting principle (“GAAP”) measure, this document contains information about Adjusted EBITDA (net income (loss) attributable to Tecogen Inc adjusted for interest, income taxes, depreciation and amortization, stock-based compensation expense, unrealized gain or loss on investment securities, goodwill impairment charges and other non-cash non-recurring charges including abandonment of certain intangible assets and extinguishment of debt), which is a non-GAAP measure. The Company believes Adjusted EBITDA allows investors to view its performance in a manner similar to the methods used by management and provides additional insight into its operating results. Adjusted EBITDA is not calculated through the application of GAAP. Accordingly, it should not be considered as a substitute for the GAAP measure of net income and, therefore, should not be used in isolation of, but in conjunction with, the GAAP measure. The use of any non-GAAP measure may produce results that vary from the GAAP measure and may not be comparable to a similarly defined non-GAAP measure used by other companies. (2) The Adjusted EBITDA for FY 2021 benefits from $1.2 million of Employee Retention Credit.
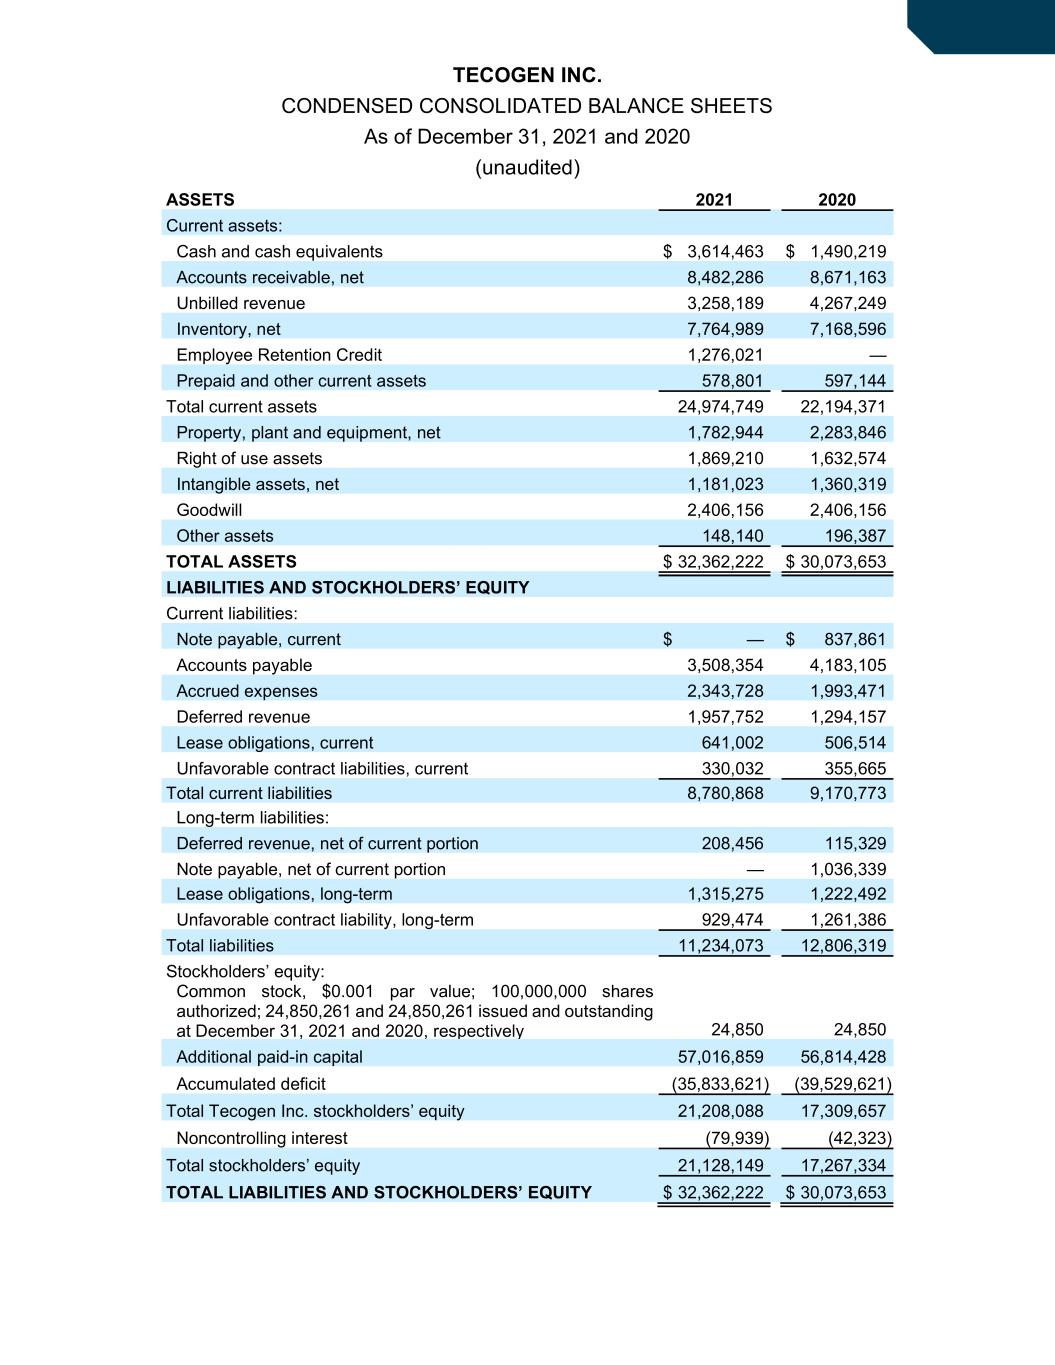
TECOGEN INC. CONDENSED CONSOLIDATED BALANCE SHEETS As of December 31, 2021 and 2020 (unaudited) ASSETS 2021 2020 Current assets: Cash and cash equivalents $ 3,614,463 $ 1,490,219 Accounts receivable, net 8,482,286 8,671,163 Unbilled revenue 3,258,189 4,267,249 Inventory, net 7,764,989 7,168,596 Employee Retention Credit 1,276,021 — Prepaid and other current assets 578,801 597,144 Total current assets 24,974,749 22,194,371 Property, plant and equipment, net 1,782,944 2,283,846 Right of use assets 1,869,210 1,632,574 Intangible assets, net 1,181,023 1,360,319 Goodwill 2,406,156 2,406,156 Other assets 148,140 196,387 TOTAL ASSETS $ 32,362,222 $ 30,073,653 LIABILITIES AND STOCKHOLDERS’ EQUITY Current liabilities: Note payable, current $ — $ 837,861 Accounts payable 3,508,354 4,183,105 Accrued expenses 2,343,728 1,993,471 Deferred revenue 1,957,752 1,294,157 Lease obligations, current 641,002 506,514 Unfavorable contract liabilities, current 330,032 355,665 Total current liabilities 8,780,868 9,170,773 Long-term liabilities: Deferred revenue, net of current portion 208,456 115,329 Note payable, net of current portion — 1,036,339 Lease obligations, long-term 1,315,275 1,222,492 Unfavorable contract liability, long-term 929,474 1,261,386 Total liabilities 11,234,073 12,806,319 Stockholders’ equity: Common stock, $0.001 par value; 100,000,000 shares authorized; 24,850,261 and 24,850,261 issued and outstanding at December 31, 2021 and 2020, respectively 24,850 24,850 Additional paid-in capital 57,016,859 56,814,428 Accumulated deficit (35,833,621) (39,529,621) Total Tecogen Inc. stockholders’ equity 21,208,088 17,309,657 Noncontrolling interest (79,939) (42,323) Total stockholders’ equity 21,128,149 17,267,334 TOTAL LIABILITIES AND STOCKHOLDERS’ EQUITY $ 32,362,222 $ 30,073,653
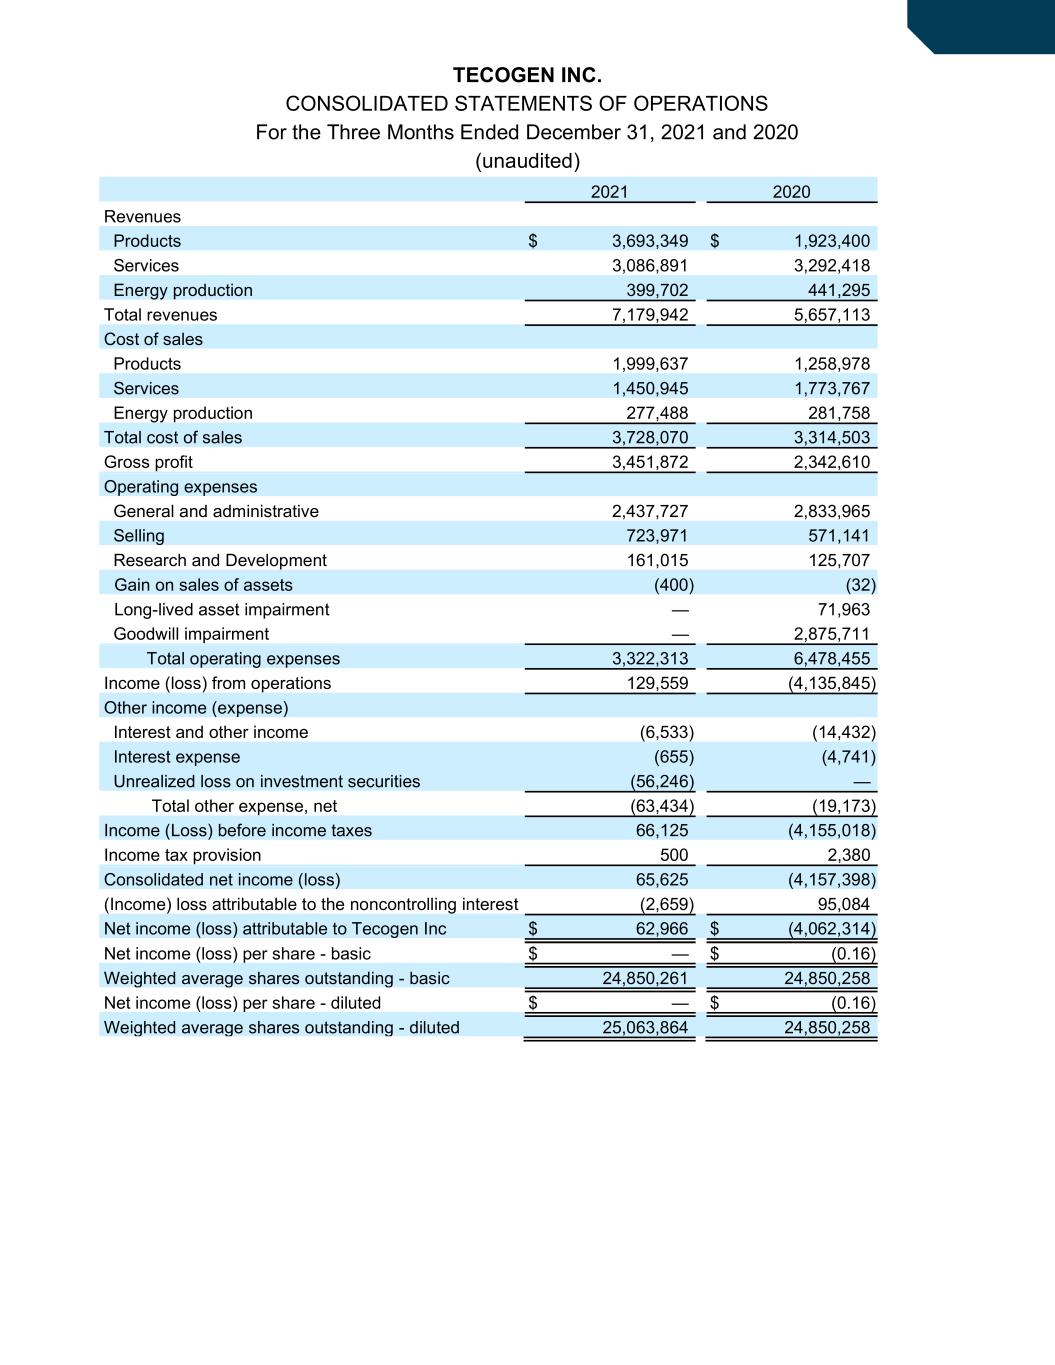
TECOGEN INC. CONSOLIDATED STATEMENTS OF OPERATIONS For the Three Months Ended December 31, 2021 and 2020 (unaudited) 2021 2020 Revenues Products $ 3,693,349 $ 1,923,400 Services 3,086,891 3,292,418 Energy production 399,702 441,295 Total revenues 7,179,942 5,657,113 Cost of sales Products 1,999,637 1,258,978 Services 1,450,945 1,773,767 Energy production 277,488 281,758 Total cost of sales 3,728,070 3,314,503 Gross profit 3,451,872 2,342,610 Operating expenses General and administrative 2,437,727 2,833,965 Selling 723,971 571,141 Research and Development 161,015 125,707 Gain on sales of assets (400) (32) Long-lived asset impairment — 71,963 Goodwill impairment — 2,875,711 Total operating expenses 3,322,313 6,478,455 Income (loss) from operations 129,559 (4,135,845) Other income (expense) Interest and other income (6,533) (14,432) Interest expense (655) (4,741) Unrealized loss on investment securities (56,246) — Total other expense, net (63,434) (19,173) Income (Loss) before income taxes 66,125 (4,155,018) Income tax provision 500 2,380 Consolidated net income (loss) 65,625 (4,157,398) (Income) loss attributable to the noncontrolling interest (2,659) 95,084 Net income (loss) attributable to Tecogen Inc $ 62,966 $ (4,062,314) Net income (loss) per share - basic $ — $ (0.16) Weighted average shares outstanding - basic 24,850,261 24,850,258 Net income (loss) per share - diluted $ — $ (0.16) Weighted average shares outstanding - diluted 25,063,864 24,850,258
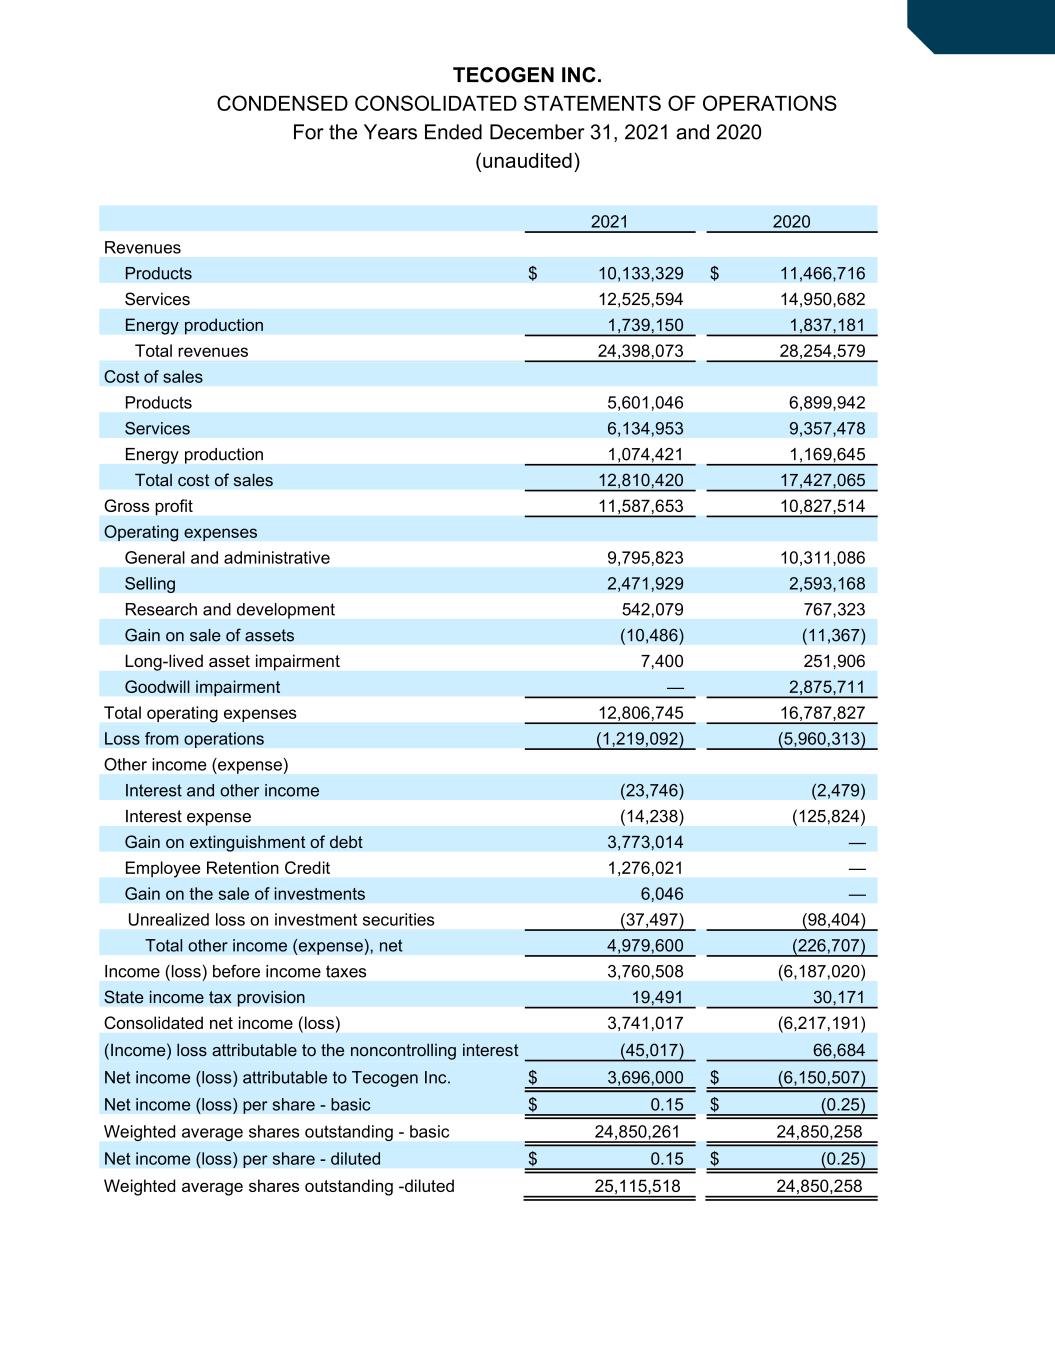
TECOGEN INC. CONDENSED CONSOLIDATED STATEMENTS OF OPERATIONS For the Years Ended December 31, 2021 and 2020 (unaudited) 2021 2020 Revenues Products $ 10,133,329 $ 11,466,716 Services 12,525,594 14,950,682 Energy production 1,739,150 1,837,181 Total revenues 24,398,073 28,254,579 Cost of sales Products 5,601,046 6,899,942 Services 6,134,953 9,357,478 Energy production 1,074,421 1,169,645 Total cost of sales 12,810,420 17,427,065 Gross profit 11,587,653 10,827,514 Operating expenses General and administrative 9,795,823 10,311,086 Selling 2,471,929 2,593,168 Research and development 542,079 767,323 Gain on sale of assets (10,486) (11,367) Long-lived asset impairment 7,400 251,906 Goodwill impairment — 2,875,711 Total operating expenses 12,806,745 16,787,827 Loss from operations (1,219,092) (5,960,313) Other income (expense) Interest and other income (23,746) (2,479) Interest expense (14,238) (125,824) Gain on extinguishment of debt 3,773,014 — Employee Retention Credit 1,276,021 — Gain on the sale of investments 6,046 — Unrealized loss on investment securities (37,497) (98,404) Total other income (expense), net 4,979,600 (226,707) Income (loss) before income taxes 3,760,508 (6,187,020) State income tax provision 19,491 30,171 Consolidated net income (loss) 3,741,017 (6,217,191) (Income) loss attributable to the noncontrolling interest (45,017) 66,684 Net income (loss) attributable to Tecogen Inc. $ 3,696,000 $ (6,150,507) Net income (loss) per share - basic $ 0.15 $ (0.25) Weighted average shares outstanding - basic 24,850,261 24,850,258 Net income (loss) per share - diluted $ 0.15 $ (0.25) Weighted average shares outstanding -diluted 25,115,518 24,850,258
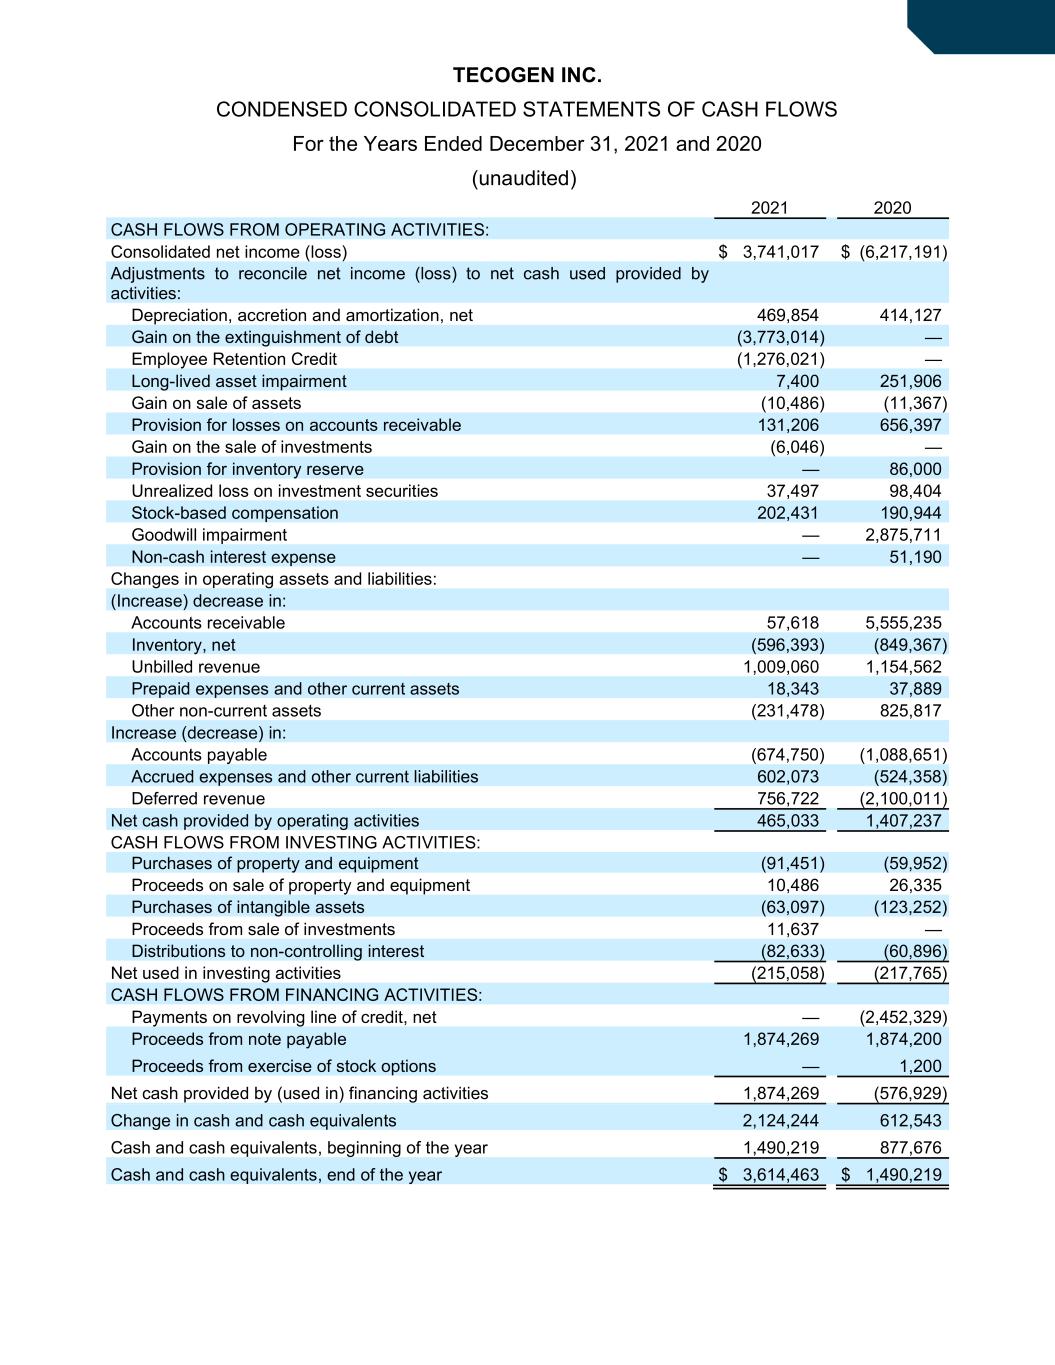
TECOGEN INC. CONDENSED CONSOLIDATED STATEMENTS OF CASH FLOWS For the Years Ended December 31, 2021 and 2020 (unaudited) 2021 2020 CASH FLOWS FROM OPERATING ACTIVITIES: Consolidated net income (loss) $ 3,741,017 $ (6,217,191) Adjustments to reconcile net income (loss) to net cash used provided by activities: Depreciation, accretion and amortization, net 469,854 414,127 Gain on the extinguishment of debt (3,773,014) — Employee Retention Credit (1,276,021) — Long-lived asset impairment 7,400 251,906 Gain on sale of assets (10,486) (11,367) Provision for losses on accounts receivable 131,206 656,397 Gain on the sale of investments (6,046) — Provision for inventory reserve — 86,000 Unrealized loss on investment securities 37,497 98,404 Stock-based compensation 202,431 190,944 Goodwill impairment — 2,875,711 Non-cash interest expense — 51,190 Changes in operating assets and liabilities: (Increase) decrease in: Accounts receivable 57,618 5,555,235 Inventory, net (596,393) (849,367) Unbilled revenue 1,009,060 1,154,562 Prepaid expenses and other current assets 18,343 37,889 Other non-current assets (231,478) 825,817 Increase (decrease) in: Accounts payable (674,750) (1,088,651) Accrued expenses and other current liabilities 602,073 (524,358) Deferred revenue 756,722 (2,100,011) Net cash provided by operating activities 465,033 1,407,237 CASH FLOWS FROM INVESTING ACTIVITIES: Purchases of property and equipment (91,451) (59,952) Proceeds on sale of property and equipment 10,486 26,335 Purchases of intangible assets (63,097) (123,252) Proceeds from sale of investments 11,637 — Distributions to non-controlling interest (82,633) (60,896) Net used in investing activities (215,058) (217,765) CASH FLOWS FROM FINANCING ACTIVITIES: Payments on revolving line of credit, net — (2,452,329) Proceeds from note payable 1,874,269 1,874,200 Proceeds from exercise of stock options — 1,200 Net cash provided by (used in) financing activities 1,874,269 (576,929) Change in cash and cash equivalents 2,124,244 612,543 Cash and cash equivalents, beginning of the year 1,490,219 877,676 Cash and cash equivalents, end of the year $ 3,614,463 $ 1,490,219
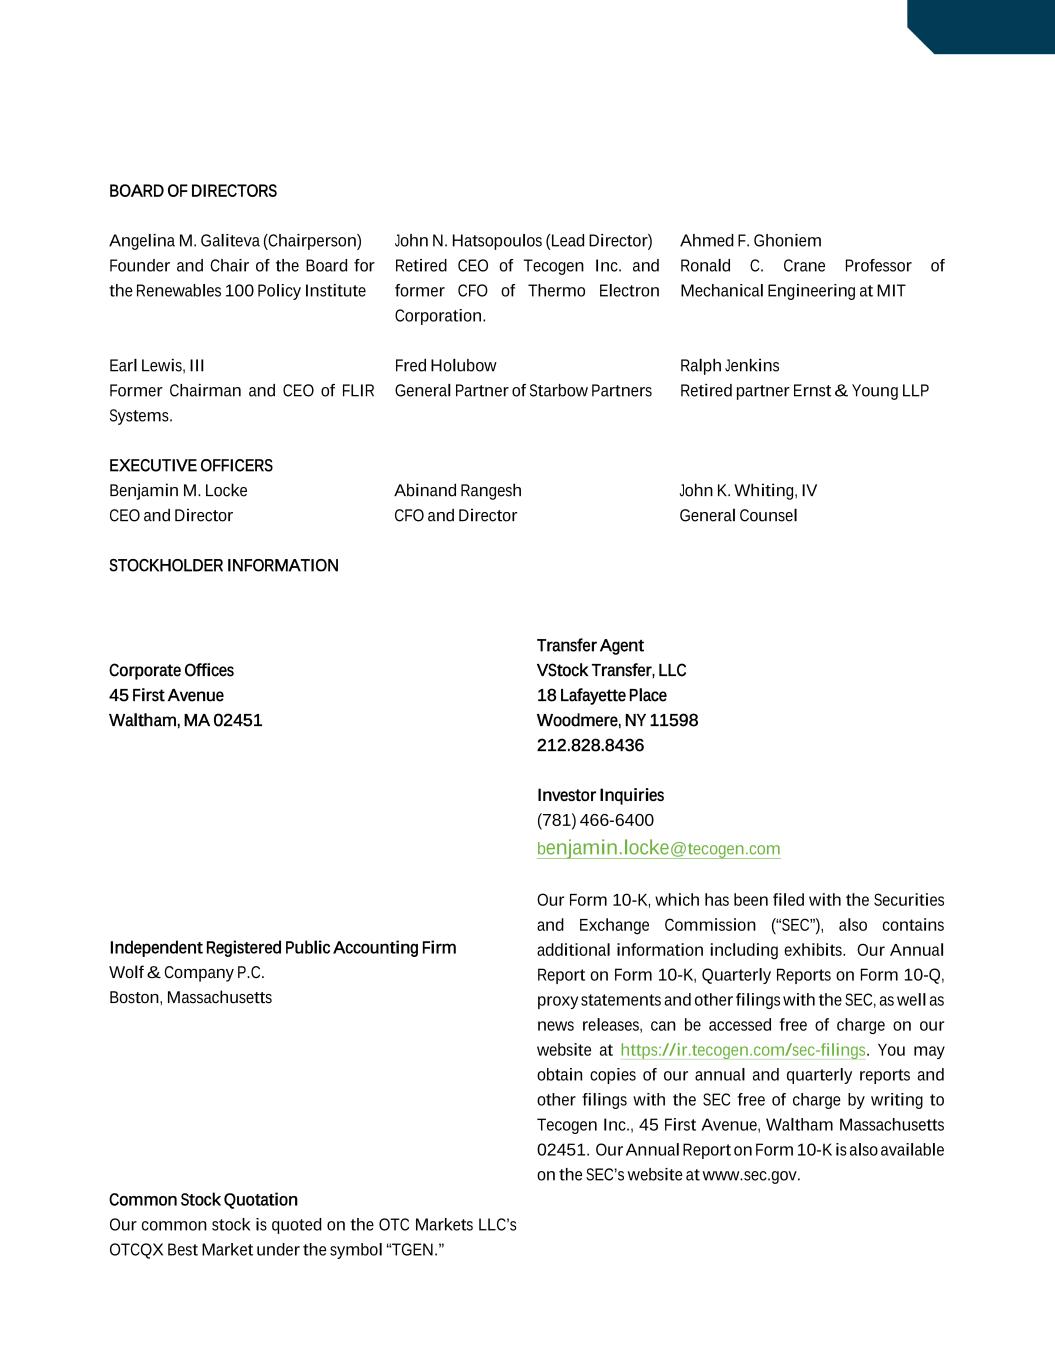
BOARD OF DIRECTORS Angelina M. Galiteva (Chairperson) Founder and Chair of the Board for the Renewables 100 Policy Institute John N. Hatsopoulos (Lead Director) Retired CEO of Tecogen Inc. and former CFO of Thermo Electron Corporation. Ahmed F. Ghoniem Ronald C. Crane Professor of Mechanical Engineering at MIT Earl Lewis, III Former Chairman and CEO of FLIR Systems. Fred Holubow General Partner of Starbow Partners Ralph Jenkins Retired partner Ernst & Young LLP EXECUTIVE OFFICERS Benjamin M. Locke CEO and Director Abinand Rangesh CFO and Director John K. Whiting, IV General Counsel STOCKHOLDER INFORMATION Corporate Offices 45 First Avenue Waltham, MA 02451 Transfer Agent VStock Transfer, LLC 18 Lafayette Place Woodmere, NY 11598 212.828.8436 Independent Registered Public Accounting Firm Wolf & Company P.C. Boston, Massachusetts Investor Inquiries (781) 466-6400 benjamin.locke@tecogen.com Our Form 10-K, which has been filed with the Securities and Exchange Commission (“SEC”), also contains additional information including exhibits. Our Annual Report on Form 10-K, Quarterly Reports on Form 10-Q, proxy statements and other filings with the SEC, as well as news releases, can be accessed free of charge on our website at https://ir.tecogen.com/sec-filings. You may obtain copies of our annual and quarterly reports and other filings with the SEC free of charge by writing to Tecogen Inc., 45 First Avenue, Waltham Massachusetts 02451. Our Annual Report on Form 10-K is also available on the SEC’s website at www.sec.gov. Common Stock Quotation Our common stock is quoted on the OTC Markets LLC’s OTCQX Best Market under the symbol “TGEN.”