OTCQX: TGEN NOVEMBER 10, 2022 Q3 2022 EARNINGS CALL 1
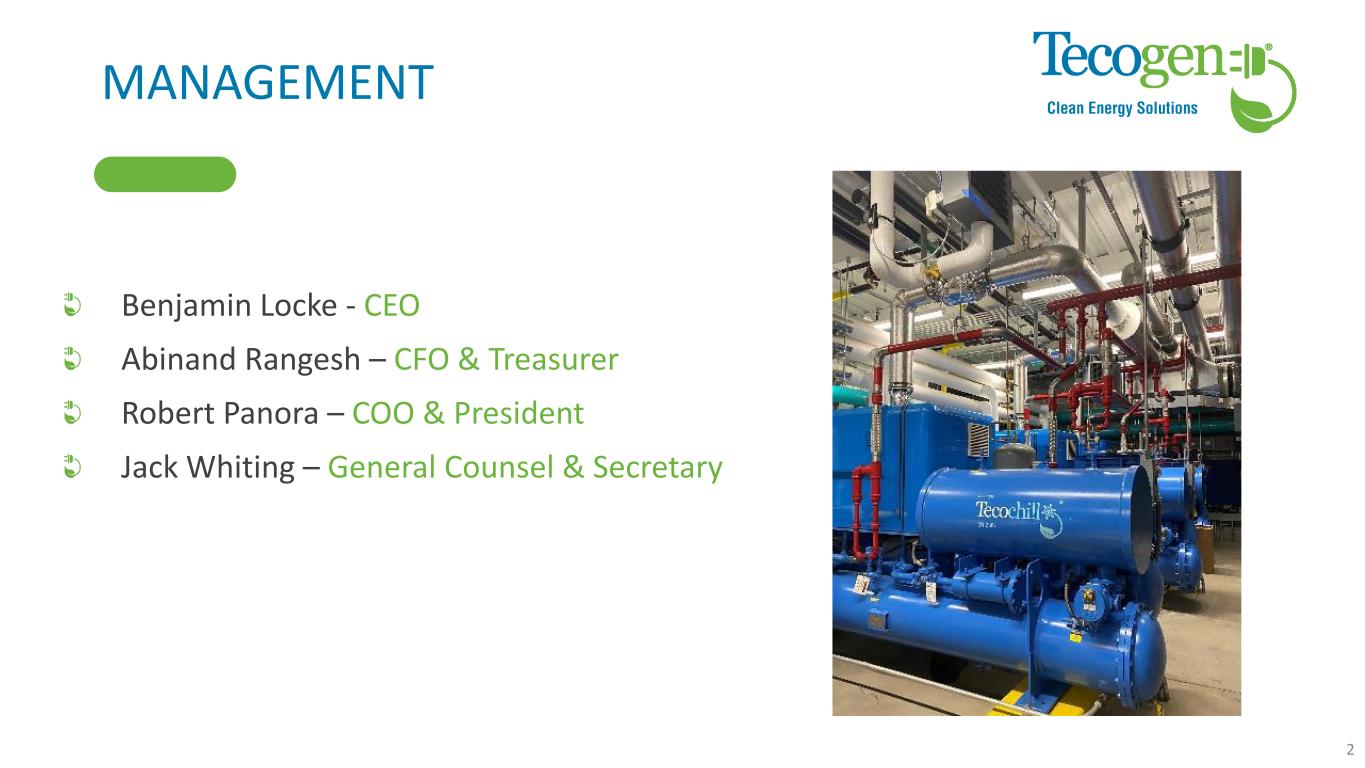
MANAGEMENT Benjamin Locke - CEO Abinand Rangesh – CFO & Treasurer Robert Panora – COO & President Jack Whiting – General Counsel & Secretary 2
SAFE HARBOR STATEMENT This presentation and accompanying documents contain “forward-looking statements” which may describe strategies, goals, outlooks or other non- historical matters, or projected revenues, Income, returns or other financial measures, that may include words such as "believe," "expect," "anticipate," "intend," "plan," "estimate," "project," "target," "potential," "will," "should," "could," "likely," or "may" and similar expressions intended to identify forward-looking statements. These statements are only predictions and involve known and unknown risks, uncertainties, and other factors that may cause our actual results to differ materially from those expressed or implied by such forward-looking statements. Given these uncertainties, you should not place undue reliance on these forward-looking statements. Forward-looking statements speak only as of the date on which they are made, and we undertake no obligation to update or revise any forward-looking statements. In addition to those factors described in our Annual Report on Form 10-K and our Quarterly Reports on Form 10-Q under “Risk Factors”, among the factors that could cause actual results to differ materially from past and projected future results are the following: fluctuations in demand for our products and services, competing technological developments, issues relating to research and development, the availability of incentives, rebates, and tax benefits relating to our products and services, changes in the regulatory environment relating to our products and services, integration of acquired business operations, and the ability to obtain financing on favorable terms to fund existing operations and anticipated growth. In addition to GAAP financial measures, this presentation includes certain non-GAAP financial measures, including adjusted EBITDA which excludes certain expenses as described in the presentation. We use Adjusted EBITDA as an internal measure of business operating performance and believe that the presentation of non-GAAP financial measures provides a meaningful perspective of the underlying operating performance of our current business and enables investors to better understand and evaluate our historical and prospective operating performance by eliminating items that vary from period to period without correlation to our core operating performance and highlights trends in our business that may not otherwise be apparent when relying solely on GAAP financial measures. 3
AGENDA Tecogen Overview 3Q 2022 Results Earnings Takeaways Company Update Q&A 4
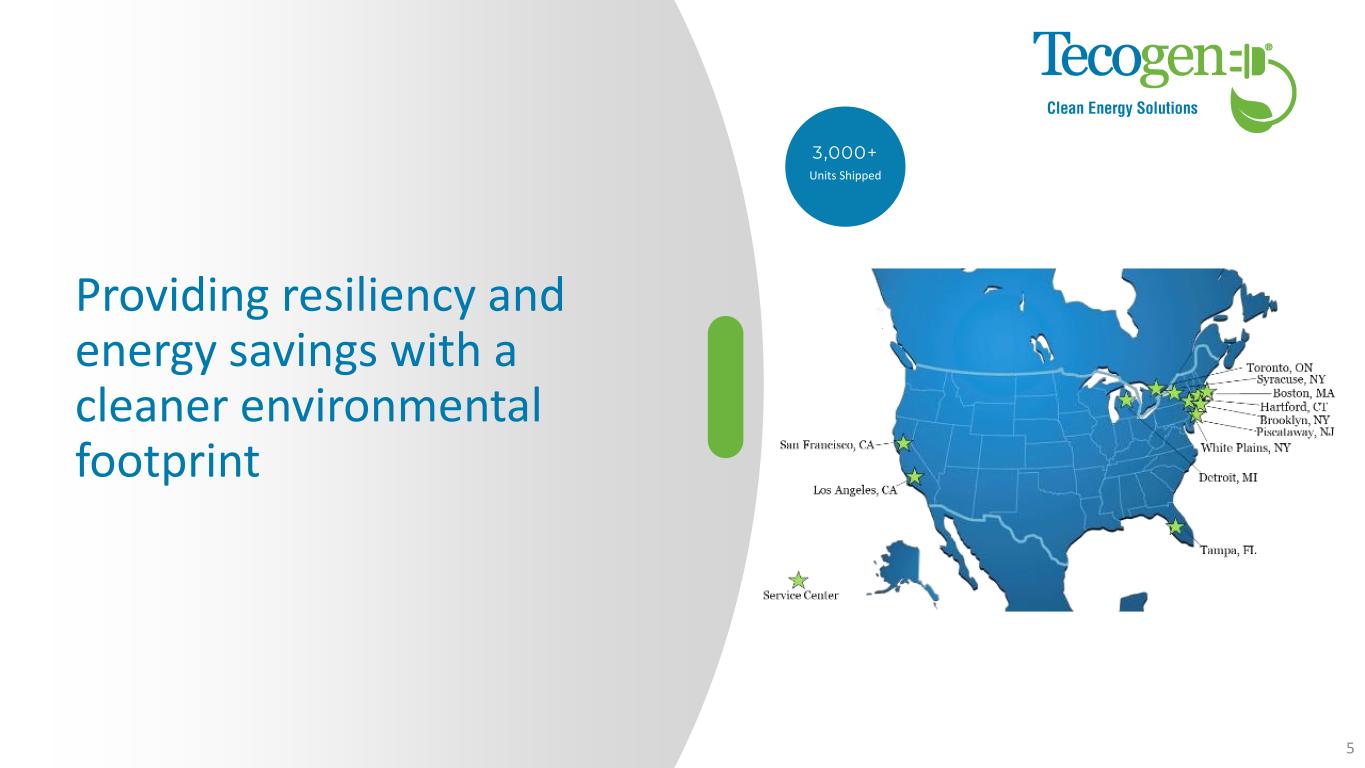
Providing resiliency and energy savings with a cleaner environmental footprint Units Shipped 5
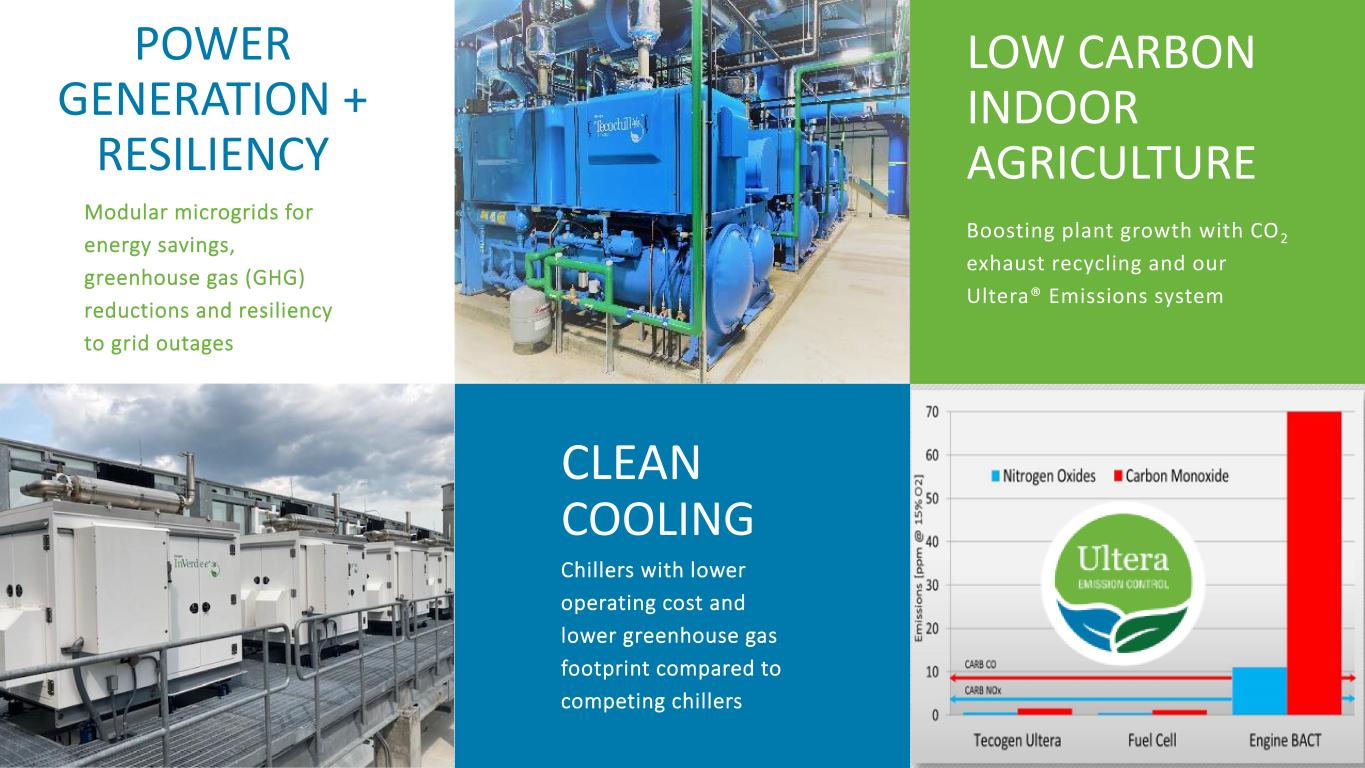
POWER GENERATION + RESILIENCY CLEAN COOLING Chillers with lower operating cost and lower greenhouse gas footprint compared to competing chillers LOW CARBON INDOOR AGRICULTURE Modular microgrids for energy savings, greenhouse gas (GHG) reductions and resiliency to grid outages Boosting plant growth with CO2 exhaust recycling and our Ultera® Emissions system
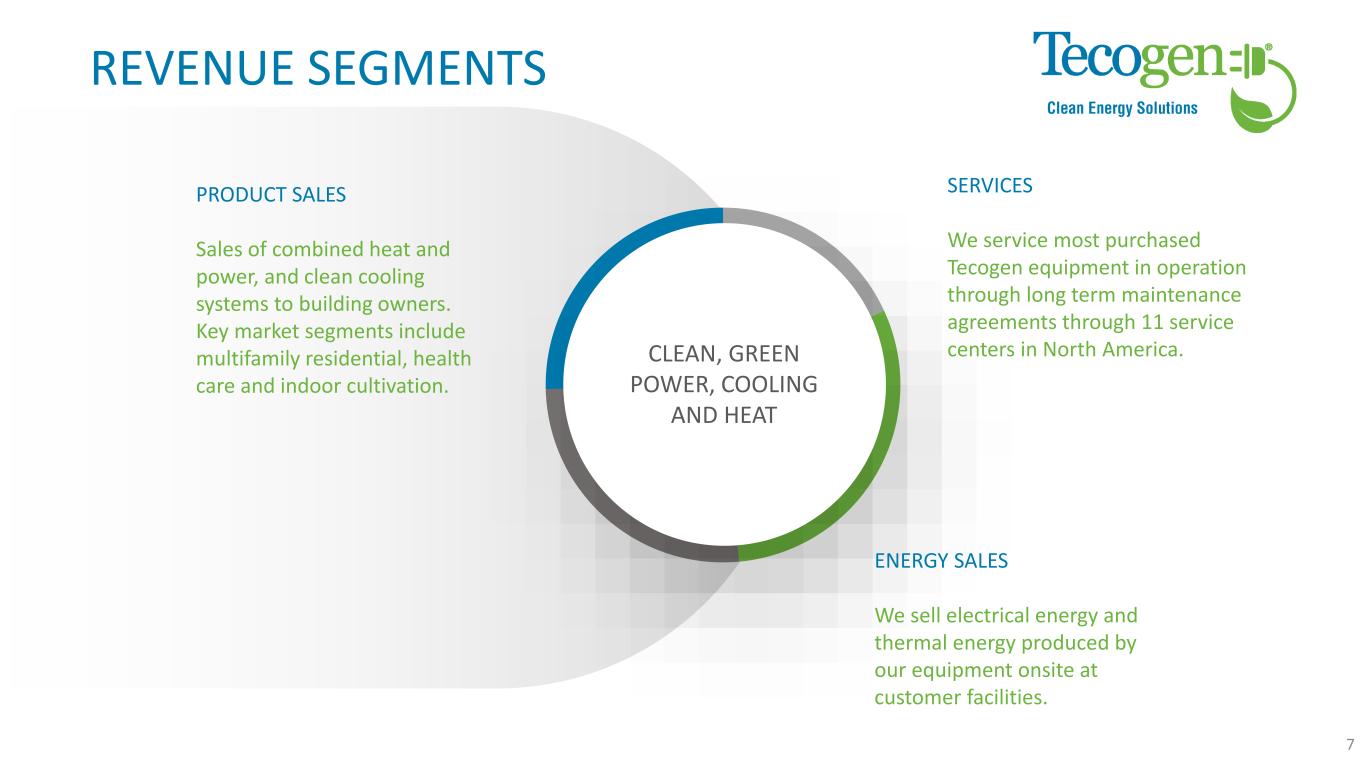
REVENUE SEGMENTS We service most purchased Tecogen equipment in operation through long term maintenance agreements through 11 service centers in North America. SERVICES CLEAN, GREEN POWER, COOLING AND HEAT Sales of combined heat and power, and clean cooling systems to building owners. Key market segments include multifamily residential, health care and indoor cultivation. PRODUCT SALES We sell electrical energy and thermal energy produced by our equipment onsite at customer facilities. ENERGY SALES 7
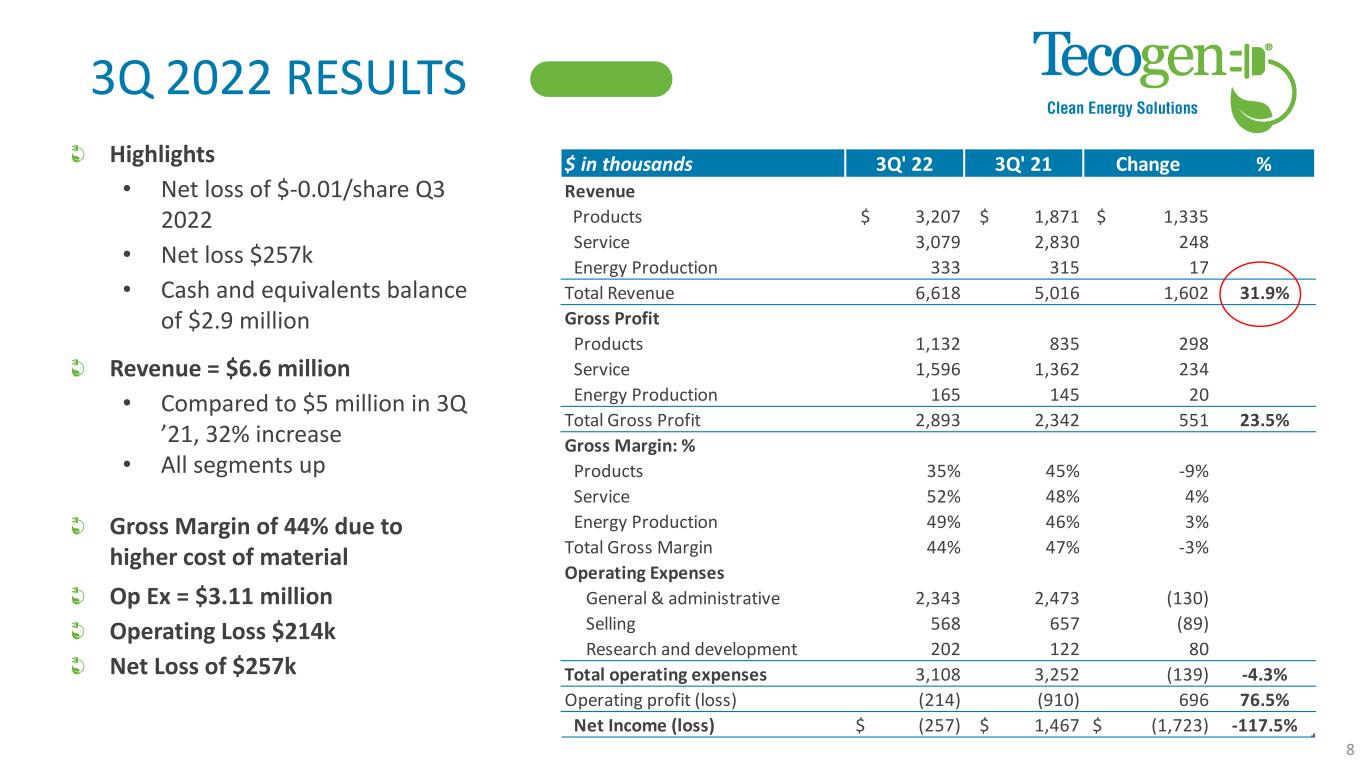
3Q 2022 RESULTS Highlights • Net loss of $-0.01/share Q3 2022 • Net loss $257k • Cash and equivalents balance of $2.9 million Revenue = $6.6 million • Compared to $5 million in 3Q ’21, 32% increase • All segments up Gross Margin of 44% due to higher cost of material Op Ex = $3.11 million Operating Loss $214k Net Loss of $257k 8 $ in thousands 3Q' 22 3Q' 21 Change % Revenue Products $ 3,207 $ 1,871 $ 1,335 Service 3,079 2,830 248 Energy Production 333 315 17 Total Revenue 6,618 5,016 1,602 31.9% Gross Profit Products 1,132 835 298 Service 1,596 1,362 234 Energy Production 165 145 20 Total Gross Profit 2,893 2,342 551 23.5% Gross Margin: % Products 35% 45% -9% Service 52% 48% 4% Energy Production 49% 46% 3% Total Gross Margin 44% 47% -3% Operating Expenses General & administrative 2,343 2,473 (130) Selling 568 657 (89) Research and development 202 122 80 Total operating expenses 3,108 3,252 (139) -4.3% Operating profit (loss) (214) (910) 696 76.5% Net Income (loss) $ (257) $ 1,467 $ (1,723) -117.5%
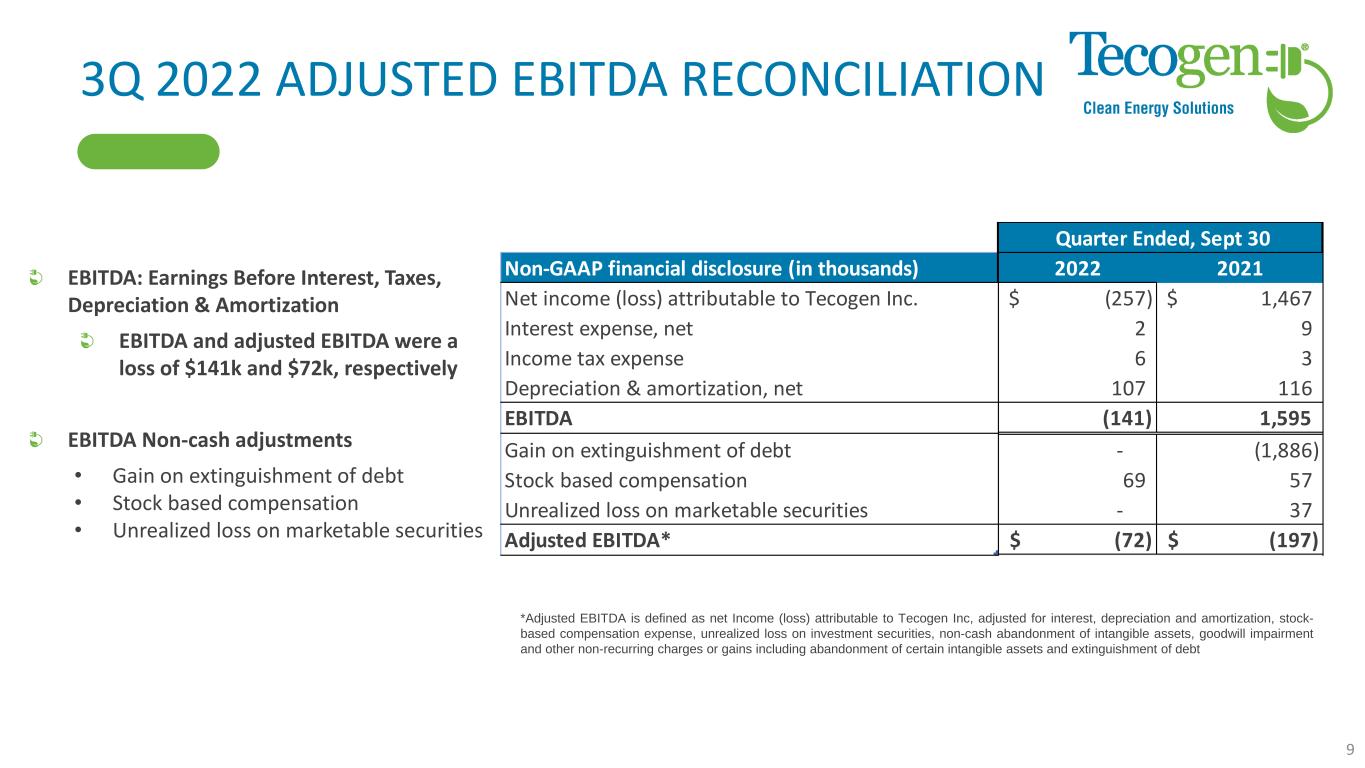
3Q 2022 ADJUSTED EBITDA RECONCILIATION EBITDA: Earnings Before Interest, Taxes, Depreciation & Amortization EBITDA and adjusted EBITDA were a loss of $141k and $72k, respectively EBITDA Non-cash adjustments • Gain on extinguishment of debt • Stock based compensation • Unrealized loss on marketable securities *Adjusted EBITDA is defined as net Income (loss) attributable to Tecogen Inc, adjusted for interest, depreciation and amortization, stock- based compensation expense, unrealized loss on investment securities, non-cash abandonment of intangible assets, goodwill impairment and other non-recurring charges or gains including abandonment of certain intangible assets and extinguishment of debt 9 Non-GAAP financial disclosure (in thousands) 2022 2021 Net income (loss) attributable to Tecogen Inc. (257)$ 1,467$ Interest expense, net 2 9 Income tax expense 6 3 Depreciation & amortization, net 107 116 EBITDA (141) 1,595 Gain on extinguishment of debt - (1,886) Stock based compensation 69 57 Unrealized loss on marketable securities - 37 Adjusted EBITDA* (72)$ (197)$ Quarter Ended, Sept 30
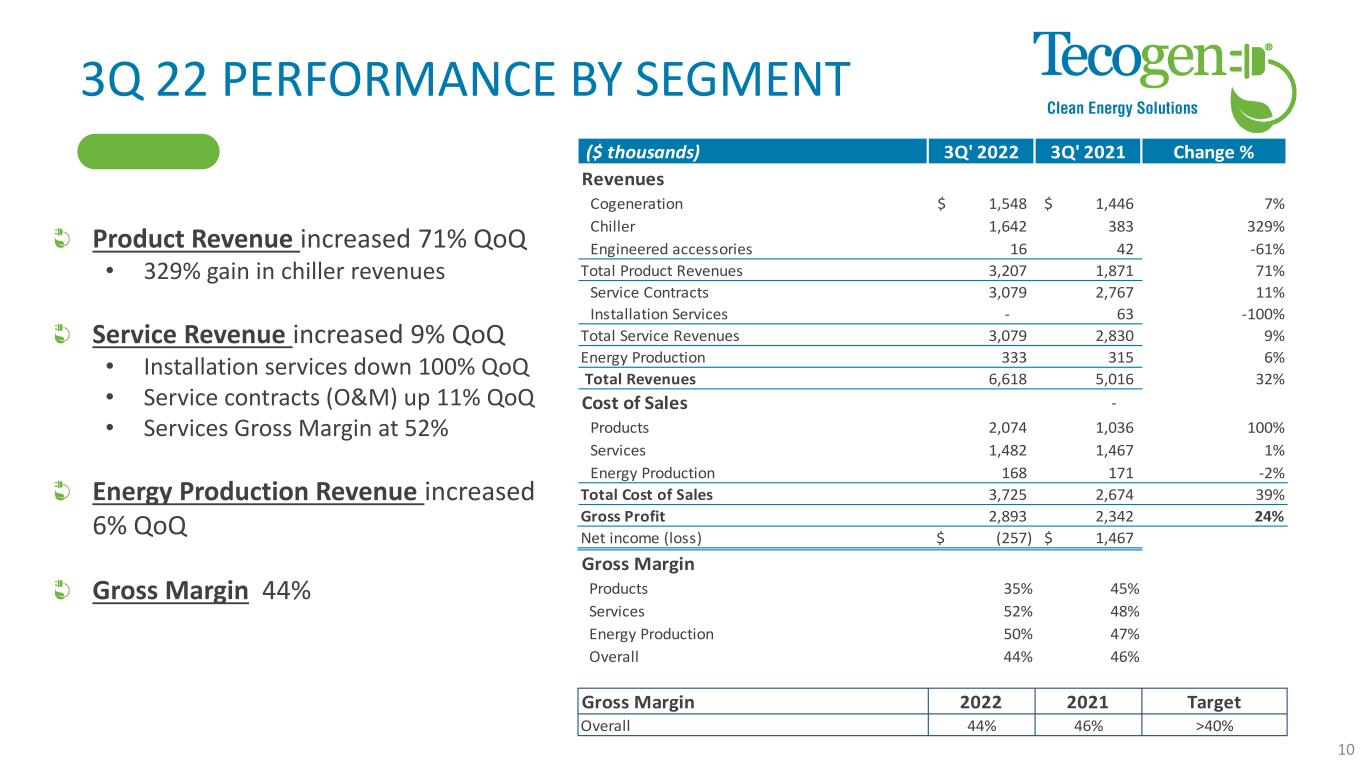
3Q 22 PERFORMANCE BY SEGMENT Product Revenue increased 71% QoQ • 329% gain in chiller revenues Service Revenue increased 9% QoQ • Installation services down 100% QoQ • Service contracts (O&M) up 11% QoQ • Services Gross Margin at 52% Energy Production Revenue increased 6% QoQ Gross Margin 44% 10 ($ thousands) 3Q' 2022 3Q' 2021 Change % Revenues Cogeneration 1,548$ 1,446$ 7% Chiller 1,642 383 329% Engineered accessories 16 42 -61% Total Product Revenues 3,207 1,871 71% Service Contracts 3,079 2,767 11% Installation Services - 63 -100% Total Service Revenues 3,079 2,830 9% Energy Production 333 315 6% Total Revenues 6,618 5,016 32% Cost of Sales - Products 2,074 1,036 100% Services 1,482 1,467 1% Energy Production 168 171 -2% Total Cost of Sales 3,725 2,674 39% Gross Profit 2,893 2,342 24% Net income (loss) (257)$ 1,467$ Gross Margin Products 35% 45% Services 52% 48% Energy Production 50% 47% Overall 44% 46% Gross Margin 2022 2021 Target Overall 44% 46% >40%
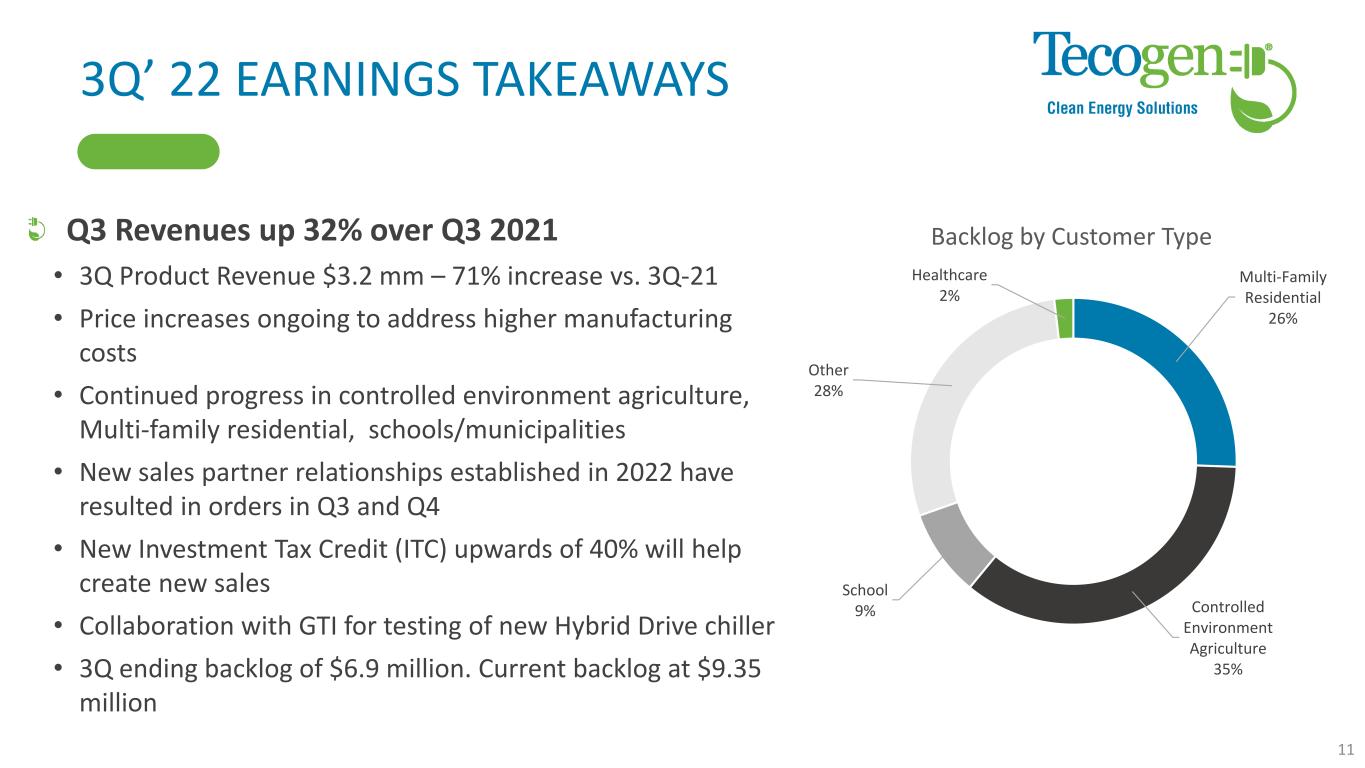
3Q’ 22 EARNINGS TAKEAWAYS Q3 Revenues up 32% over Q3 2021 • 3Q Product Revenue $3.2 mm – 71% increase vs. 3Q-21 • Price increases ongoing to address higher manufacturing costs • Continued progress in controlled environment agriculture, Multi-family residential, schools/municipalities • New sales partner relationships established in 2022 have resulted in orders in Q3 and Q4 • New Investment Tax Credit (ITC) upwards of 40% will help create new sales • Collaboration with GTI for testing of new Hybrid Drive chiller • 3Q ending backlog of $6.9 million. Current backlog at $9.35 million 11 Multi-Family Residential 26% Controlled Environment Agriculture 35% School 9% Other 28% Healthcare 2% Backlog by Customer Type
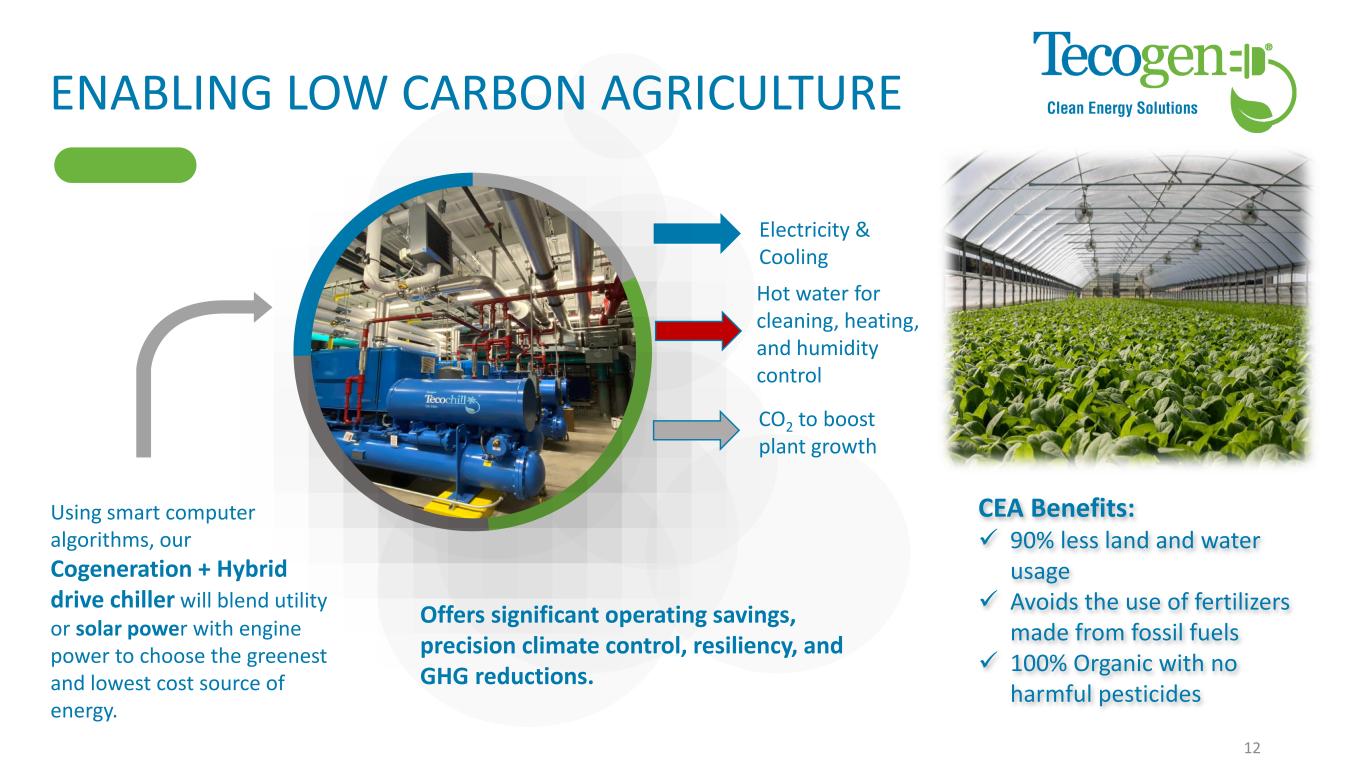
ENABLING LOW CARBON AGRICULTURE 12 Offers significant operating savings, precision climate control, resiliency, and GHG reductions. Electricity & Cooling Using smart computer algorithms, our Cogeneration + Hybrid drive chiller will blend utility or solar power with engine power to choose the greenest and lowest cost source of energy. Hot water for cleaning, heating, and humidity control CO2 to boost plant growth CEA Benefits: ✓ 90% less land and water usage ✓ Avoids the use of fertilizers made from fossil fuels ✓ 100% Organic with no harmful pesticides
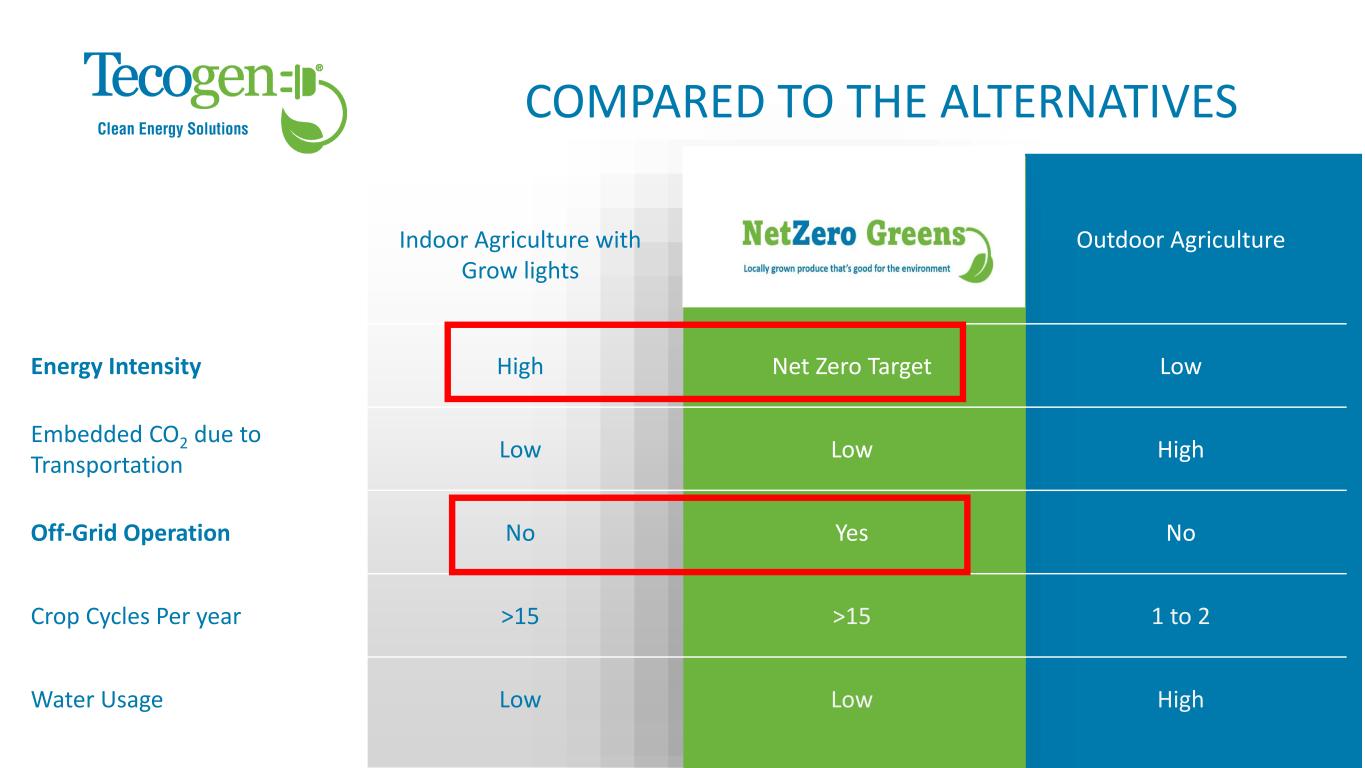
Indoor Agriculture with Grow lights Outdoor Agriculture Energy Intensity High Net Zero Target Low Embedded CO2 due to Transportation Low Low High Off-Grid Operation No Yes No Crop Cycles Per year >15 >15 1 to 2 Water Usage Low Low High COMPARED TO THE ALTERNATIVES
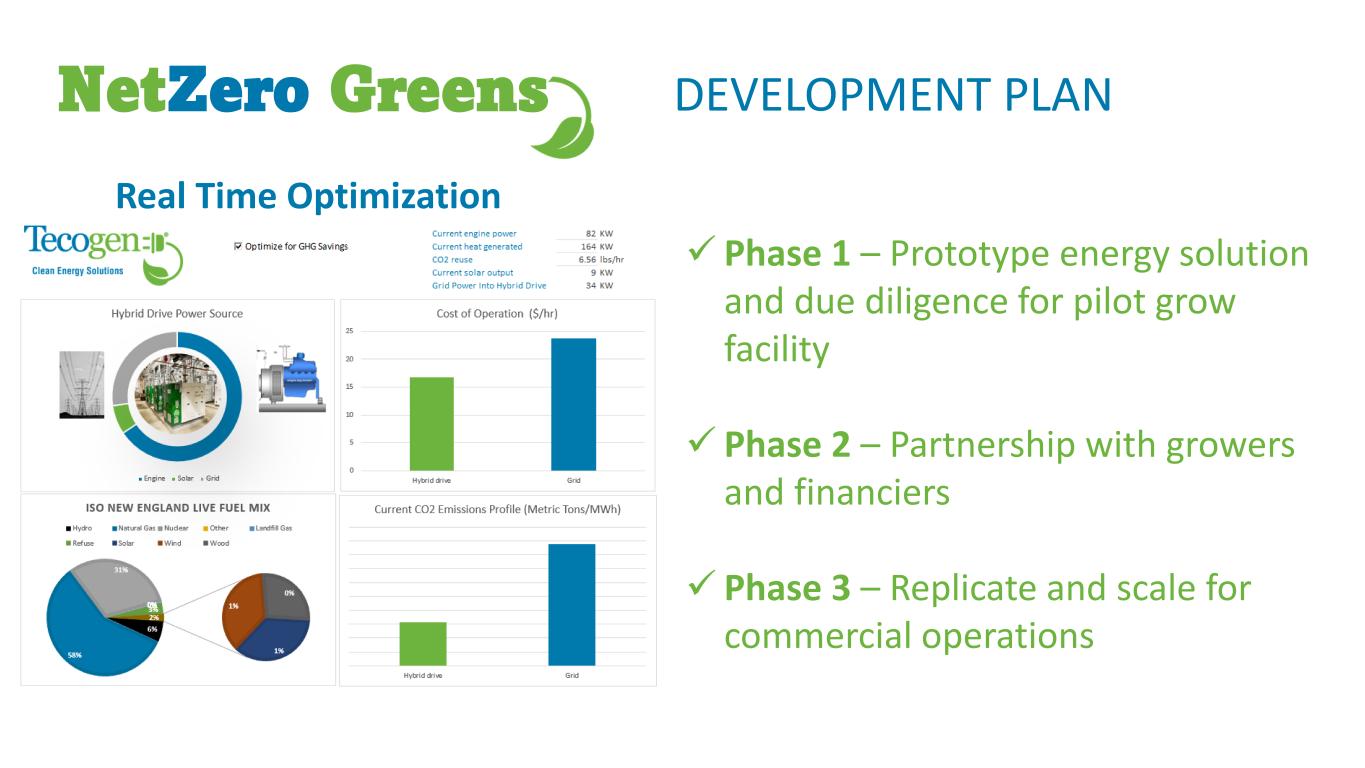
✓ Phase 1 – Prototype energy solution and due diligence for pilot grow facility ✓ Phase 2 – Partnership with growers and financiers ✓ Phase 3 – Replicate and scale for commercial operations DEVELOPMENT PLANNetZero Greens Real Time Optimization
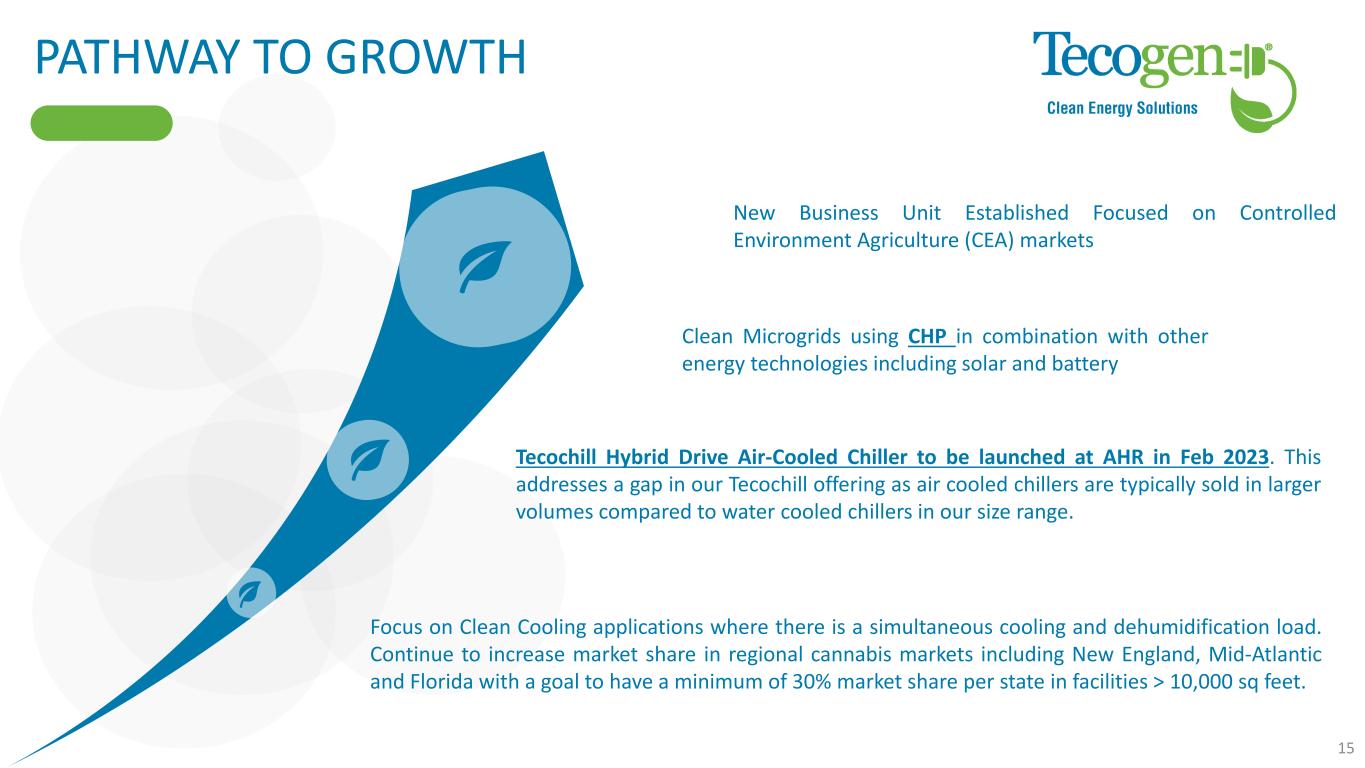
PATHWAY TO GROWTH Tecochill Hybrid Drive Air-Cooled Chiller to be launched at AHR in Feb 2023. This addresses a gap in our Tecochill offering as air cooled chillers are typically sold in larger volumes compared to water cooled chillers in our size range. Focus on Clean Cooling applications where there is a simultaneous cooling and dehumidification load. Continue to increase market share in regional cannabis markets including New England, Mid-Atlantic and Florida with a goal to have a minimum of 30% market share per state in facilities > 10,000 sq feet. Clean Microgrids using CHP in combination with other energy technologies including solar and battery 15 New Business Unit Established Focused on Controlled Environment Agriculture (CEA) markets
Q&A Company Information Tecogen, Inc 45 First Ave Waltham, MA 02451 www.Tecogen.com Contact information Benjamin Locke, CEO 781.466.6402 Benjamin.Locke@Tecogen.com 16