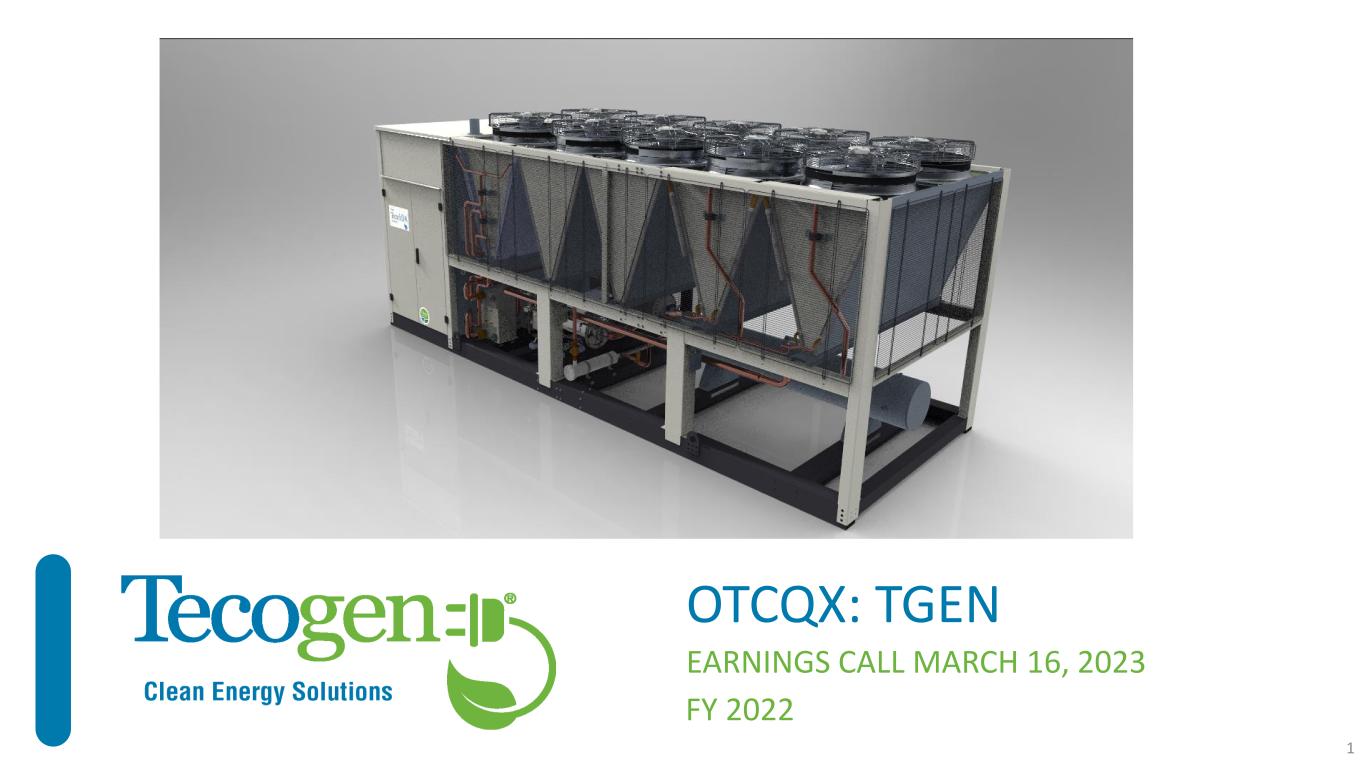
OTCQX: TGEN FY 2022 EARNINGS CALL MARCH 16, 2023 1
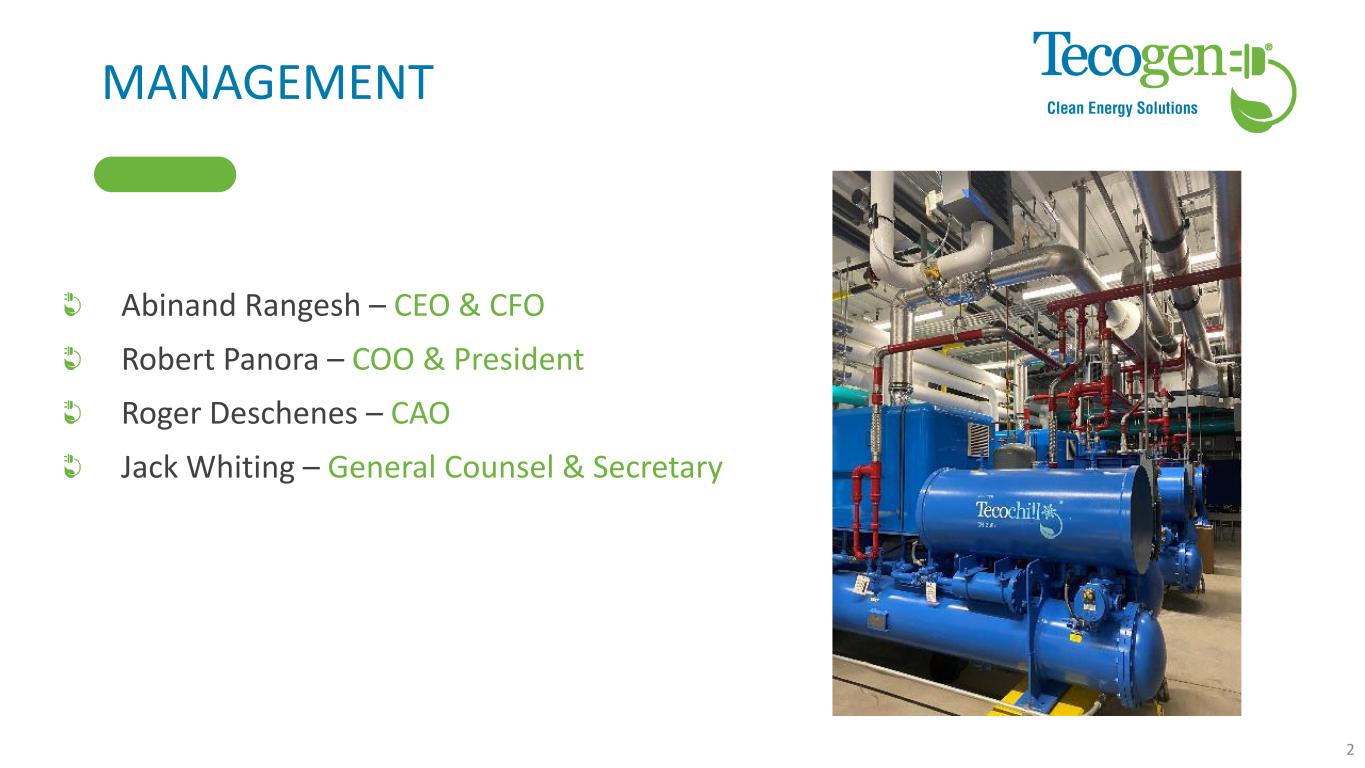
MANAGEMENT Abinand Rangesh – CEO & CFO Robert Panora – COO & President Roger Deschenes – CAO Jack Whiting – General Counsel & Secretary 2
SAFE HARBOR STATEMENT This presentation and accompanying documents contain “forward-looking statements” which may describe strategies, goals, outlooks or other non- historical matters, or projected revenues, Income, returns or other financial measures, that may include words such as "believe," "expect," "anticipate," "intend," "plan," "estimate," "project," "target," "potential," "will," "should," "could," "likely," or "may" and similar expressions intended to identify forward-looking statements. These statements are only predictions and involve known and unknown risks, uncertainties, and other factors that may cause our actual results to differ materially from those expressed or implied by such forward-looking statements. Given these uncertainties, you should not place undue reliance on these forward-looking statements. Forward-looking statements speak only as of the date on which they are made, and we undertake no obligation to update or revise any forward-looking statements. In addition to those factors described in our Annual Report on Form 10-K and our Quarterly Reports on Form 10-Q under “Risk Factors”, among the factors that could cause actual results to differ materially from past and projected future results are the following: fluctuations in demand for our products and services, competing technological developments, issues relating to research and development, the availability of incentives, rebates, and tax benefits relating to our products and services, changes in the regulatory environment relating to our products and services, integration of acquired business operations, and the ability to obtain financing on favorable terms to fund existing operations and anticipated growth. In addition to GAAP financial measures, this presentation includes certain non-GAAP financial measures, including adjusted EBITDA which excludes certain expenses as described in the presentation. We use Adjusted EBITDA as an internal measure of business operating performance and believe that the presentation of non-GAAP financial measures provides a meaningful perspective of the underlying operating performance of our current business and enables investors to better understand and evaluate our historical and prospective operating performance by eliminating items that vary from period to period without correlation to our core operating performance and highlights trends in our business that may not otherwise be apparent when relying solely on GAAP financial measures. 3
AGENDA 4Q 2022 Results FY 2022 Results Vision and 2023 Plan Competitive Advantage, Markets and Positioning Q&A 4
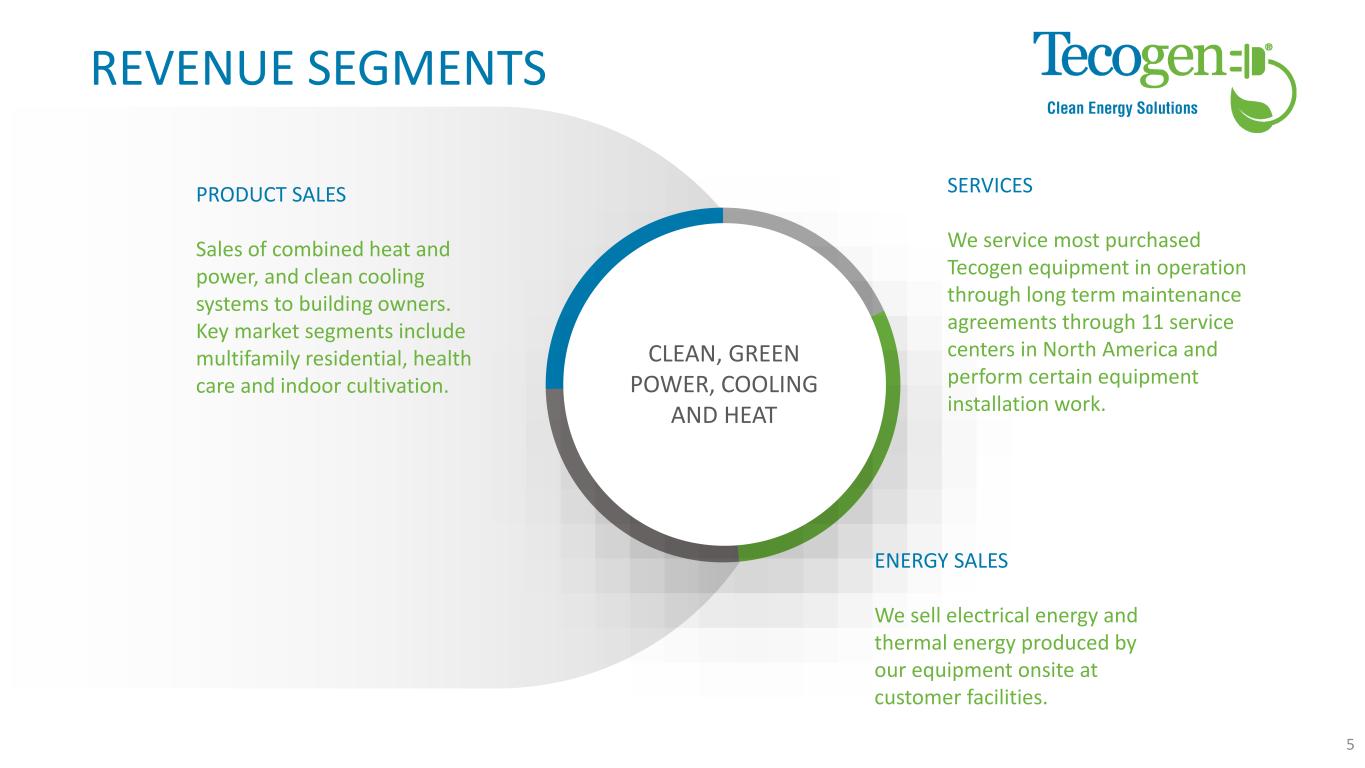
REVENUE SEGMENTS We service most purchased Tecogen equipment in operation through long term maintenance agreements through 11 service centers in North America and perform certain equipment installation work. SERVICES CLEAN, GREEN POWER, COOLING AND HEAT Sales of combined heat and power, and clean cooling systems to building owners. Key market segments include multifamily residential, health care and indoor cultivation. PRODUCT SALES We sell electrical energy and thermal energy produced by our equipment onsite at customer facilities. ENERGY SALES 5
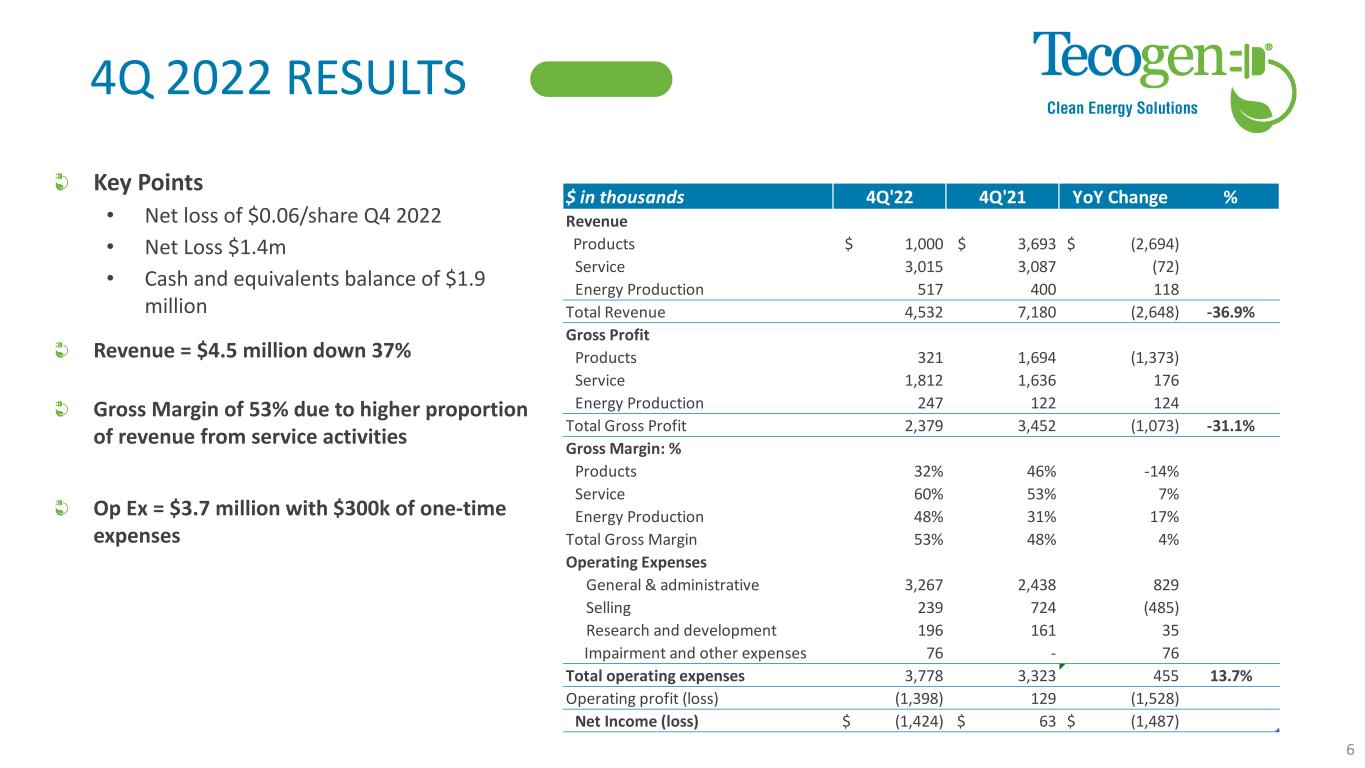
4Q 2022 RESULTS Key Points • Net loss of $0.06/share Q4 2022 • Net Loss $1.4m • Cash and equivalents balance of $1.9 million Revenue = $4.5 million down 37% Gross Margin of 53% due to higher proportion of revenue from service activities Op Ex = $3.7 million with $300k of one-time expenses 6 $ in thousands 4Q'22 4Q'21 YoY Change % Revenue Products $ 1,000 $ 3,693 $ (2,694) Service 3,015 3,087 (72) Energy Production 517 400 118 Total Revenue 4,532 7,180 (2,648) -36.9% Gross Profit Products 321 1,694 (1,373) Service 1,812 1,636 176 Energy Production 247 122 124 Total Gross Profit 2,379 3,452 (1,073) -31.1% Gross Margin: % Products 32% 46% -14% Service 60% 53% 7% Energy Production 48% 31% 17% Total Gross Margin 53% 48% 4% Operating Expenses General & administrative 3,267 2,438 829 Selling 239 724 (485) Research and development 196 161 35 Impairment and other expenses 76 - 76 Total operating expenses 3,778 3,323 455 13.7% Operating profit (loss) (1,398) 129 (1,528) -1182.8% Net Income (loss) $ (1,424) $ 63 $ (1,487) -2362.2%
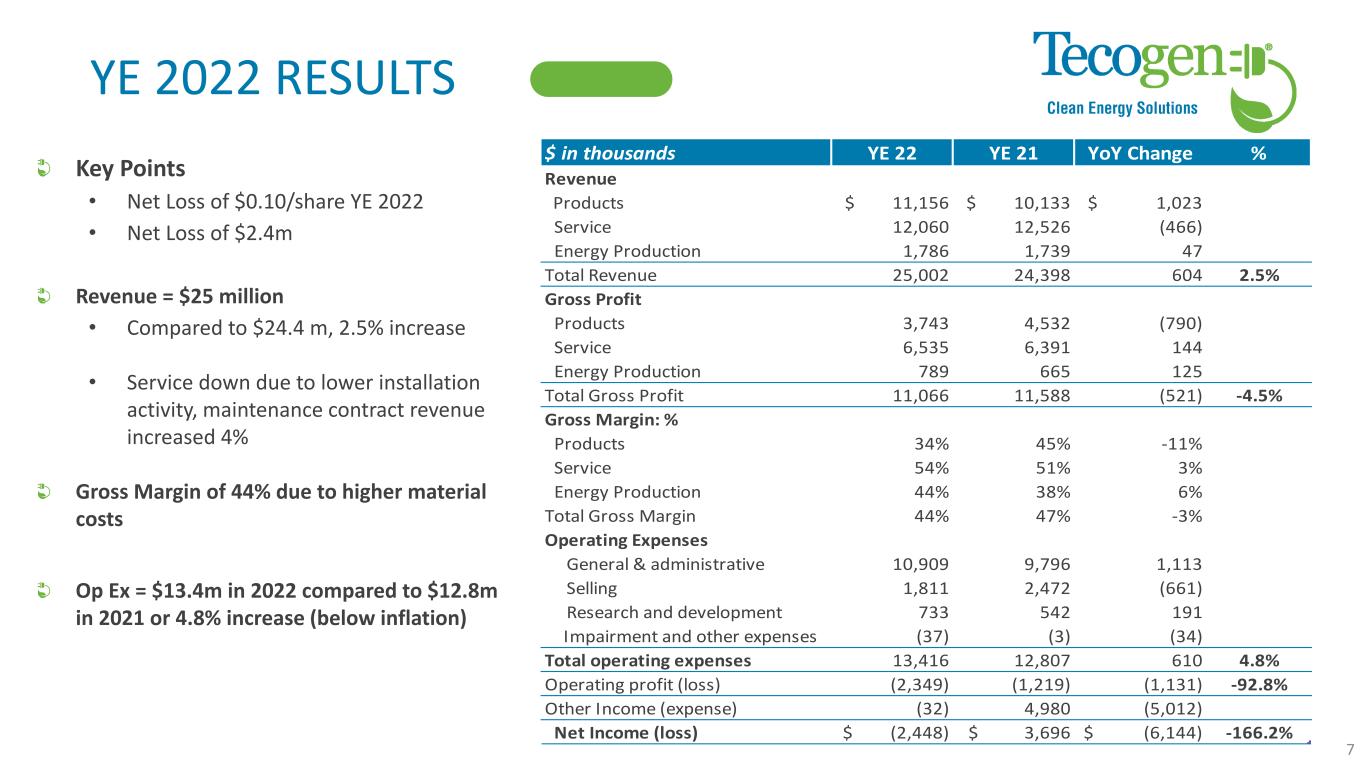
YE 2022 RESULTS Key Points • Net Loss of $0.10/share YE 2022 • Net Loss of $2.4m Revenue = $25 million • Compared to $24.4 m, 2.5% increase • Service down due to lower installation activity, maintenance contract revenue increased 4% Gross Margin of 44% due to higher material costs Op Ex = $13.4m in 2022 compared to $12.8m in 2021 or 4.8% increase (below inflation) 7 $ in thousands YE 22 YE 21 YoY Change % Revenue Products $ 11,156 $ 10,133 $ 1,023 Service 12,060 12,526 (466) Energy Production 1,786 1,739 47 Total Revenue 25,002 24,398 604 2.5% Gross Profit Products 3,743 4,532 (790) Service 6,535 6,391 144 Energy Production 789 665 125 Total Gross Profit 11,066 11,588 (521) -4.5% Gross Margin: % Products 34% 45% -11% Service 54% 51% 3% Energy Production 44% 38% 6% Total Gross Margin 44% 47% -3% Operating Expenses General & administrative 10,909 9,796 1,113 Selling 1,811 2,472 (661) Research and development 733 542 191 Impairment and other expenses (37) (3) (34) Total operating expenses 13,416 12,807 610 4.8% Operating profit (loss) (2,349) (1,219) (1,131) -92.8% Other Income (expense) (32) 4,980 (5,012) Net Income (loss) $ (2,448) $ 3,696 $ (6,144) -166.2%
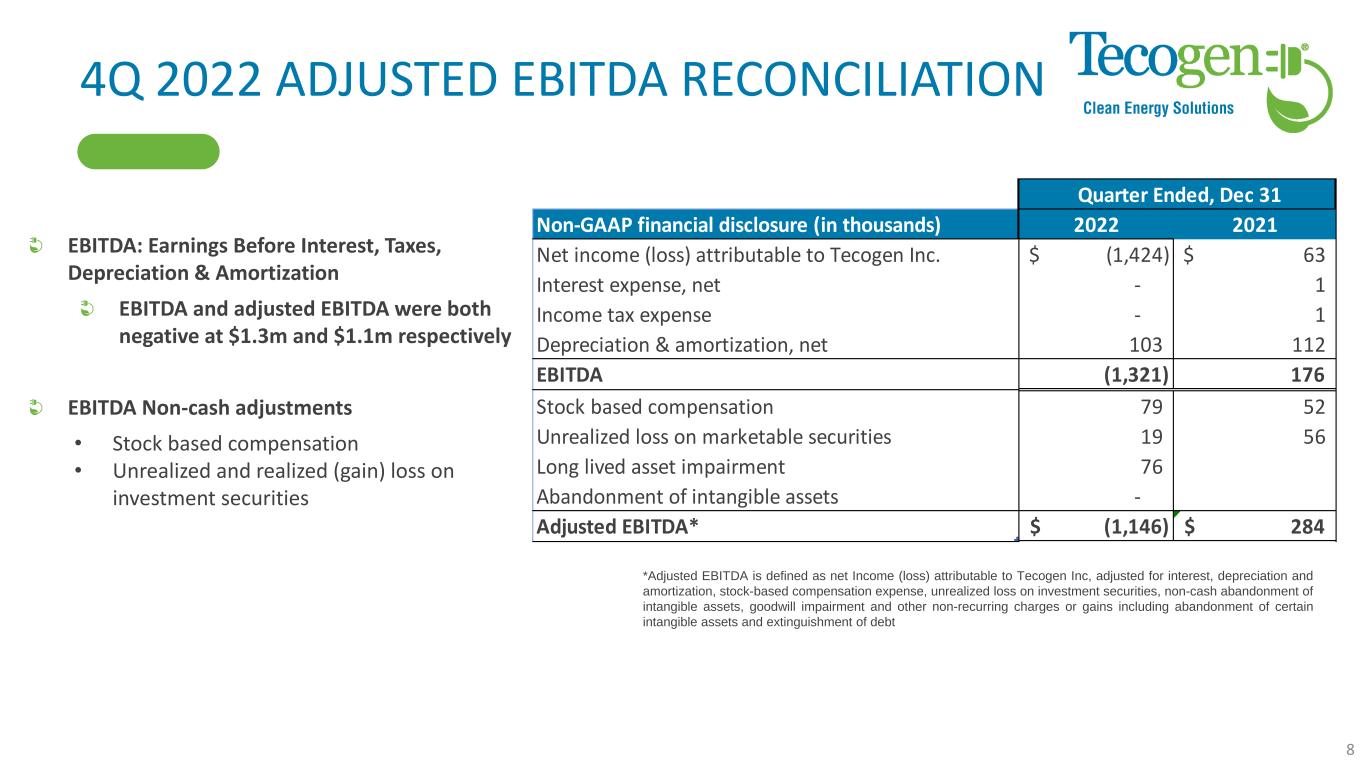
4Q 2022 ADJUSTED EBITDA RECONCILIATION EBITDA: Earnings Before Interest, Taxes, Depreciation & Amortization EBITDA and adjusted EBITDA were both negative at $1.3m and $1.1m respectively EBITDA Non-cash adjustments • Stock based compensation • Unrealized and realized (gain) loss on investment securities *Adjusted EBITDA is defined as net Income (loss) attributable to Tecogen Inc, adjusted for interest, depreciation and amortization, stock-based compensation expense, unrealized loss on investment securities, non-cash abandonment of intangible assets, goodwill impairment and other non-recurring charges or gains including abandonment of certain intangible assets and extinguishment of debt 8 Non-GAAP financial disclosure (in thousands) 2022 2021 Net income (loss) attributable to Tecogen Inc. (1,424)$ 63$ Interest expense, net - 1 Income tax expense - 1 Depreciation & amortization, net 103 112 EBITDA (1,321) 176 Stock based compensation 79 52 Unrealized loss on marketable securities 19 56 Long lived asset impairment 76 Abandonment of intangible assets - Adjusted EBITDA* (1,146)$ 284$ Quarter Ended, Dec 31
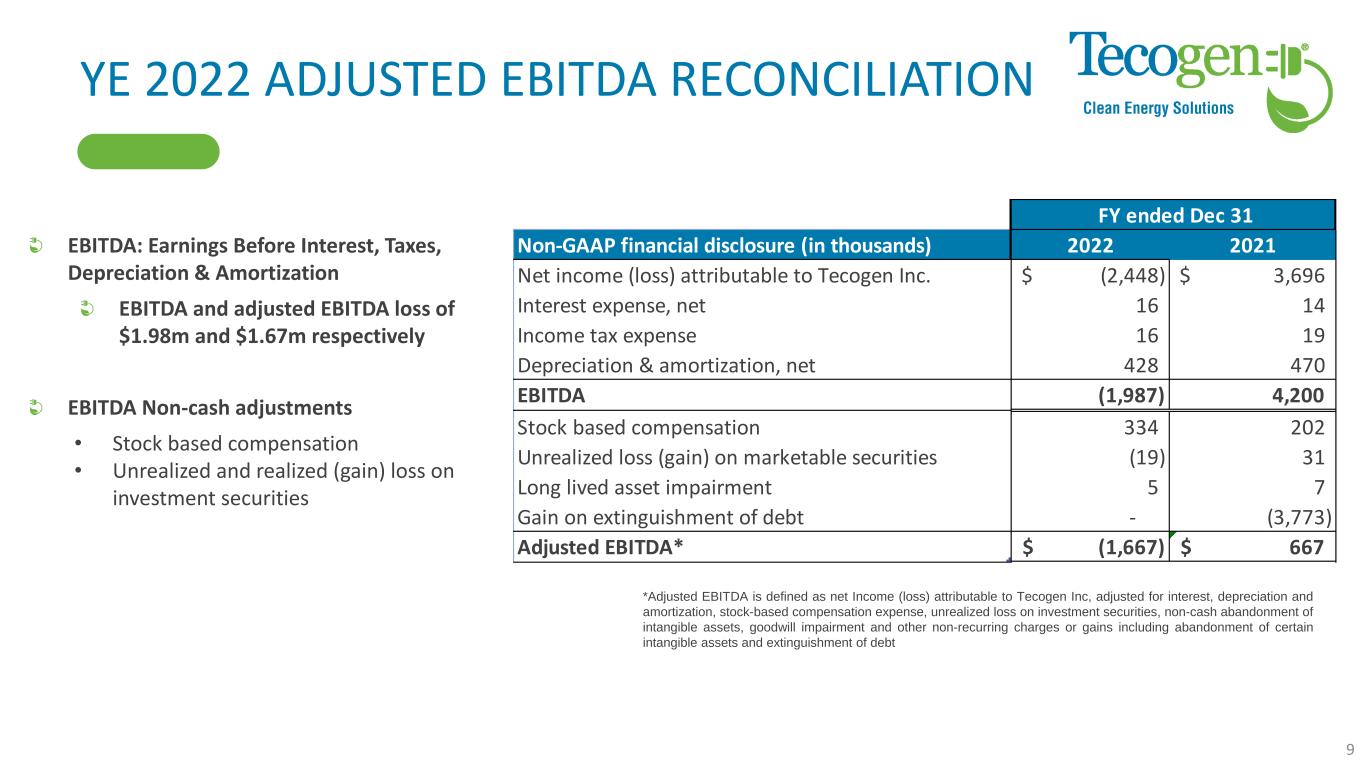
YE 2022 ADJUSTED EBITDA RECONCILIATION EBITDA: Earnings Before Interest, Taxes, Depreciation & Amortization EBITDA and adjusted EBITDA loss of $1.98m and $1.67m respectively EBITDA Non-cash adjustments • Stock based compensation • Unrealized and realized (gain) loss on investment securities *Adjusted EBITDA is defined as net Income (loss) attributable to Tecogen Inc, adjusted for interest, depreciation and amortization, stock-based compensation expense, unrealized loss on investment securities, non-cash abandonment of intangible assets, goodwill impairment and other non-recurring charges or gains including abandonment of certain intangible assets and extinguishment of debt 9 Non-GAAP financial disclosure (in thousands) 2022 2021 Net income (loss) attributable to Tecogen Inc. (2,448)$ 3,696$ Interest expense, net 16 14 Income tax expense 16 19 Depreciation & amortization, net 428 470 EBITDA (1,987) 4,200 Stock based compensation 334 202 Unrealized loss (gain) on marketable securities (19) 31 Long lived asset impairment 5 7 Gain on extinguishment of debt - (3,773) Adjusted EBITDA* (1,667)$ 667$ FY ended Dec 31
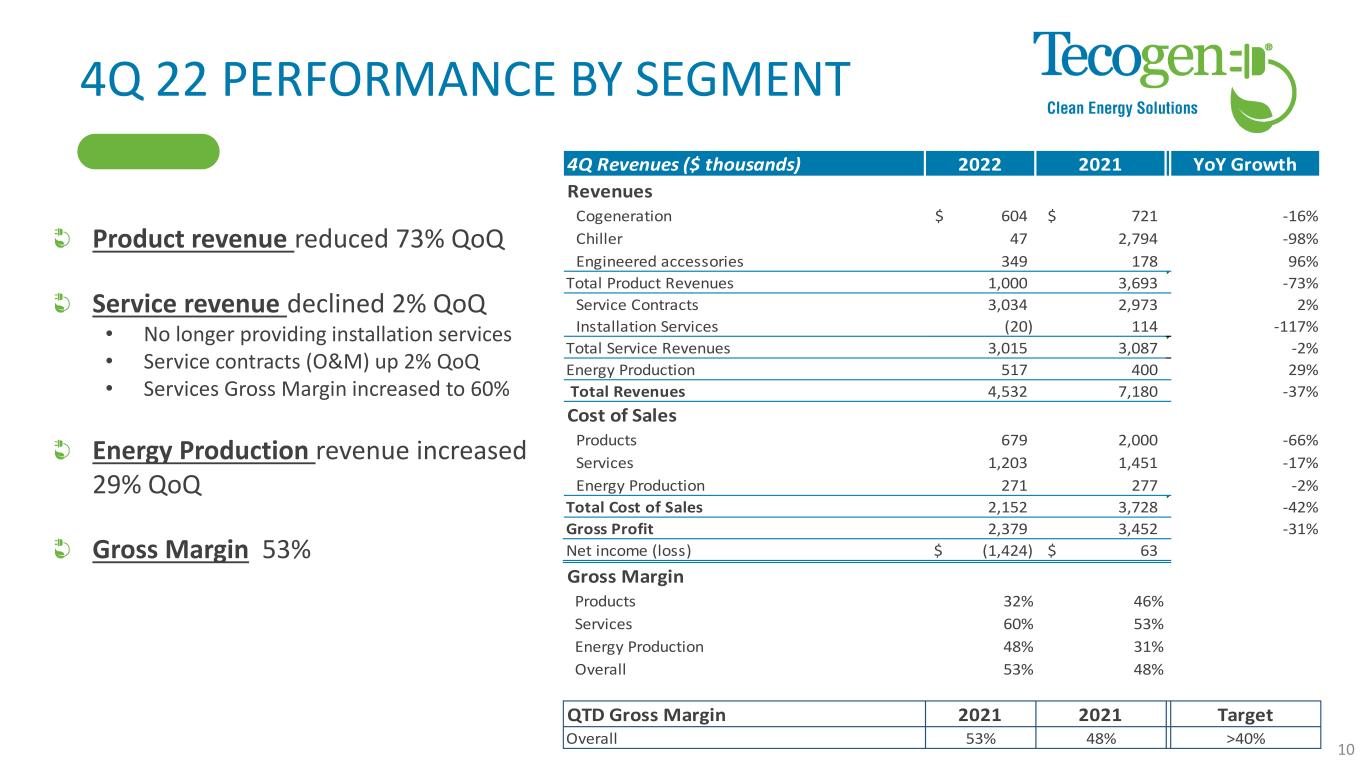
4Q 22 PERFORMANCE BY SEGMENT Product revenue reduced 73% QoQ Service revenue declined 2% QoQ • No longer providing installation services • Service contracts (O&M) up 2% QoQ • Services Gross Margin increased to 60% Energy Production revenue increased 29% QoQ Gross Margin 53% 10 4Q Revenues ($ thousands) 2022 2021 YoY Growth Revenues Cogeneration 604$ 721$ -16% Chiller 47 2,794 -98% Engineered accessories 349 178 96% Total Product Revenues 1,000 3,693 -73% Service Contracts 3,034 2,973 2% Installation Services (20) 114 -117% Total Service Revenues 3,015 3,087 -2% Energy Production 517 400 29% Total Revenues 4,532 7,180 -37% Cost of Sales Products 679 2,000 -66% Services 1,203 1,451 -17% Energy Production 271 277 -2% Total Cost of Sales 2,152 3,728 -42% Gross Profit 2,379 3,452 -31% Net income (loss) (1,424)$ 63$ Gross Margin Products 32% 46% Services 60% 53% Energy Production 48% 31% Overall 53% 48% QTD Gross Margin 2021 2021 Target Overall 53% 48% >40%
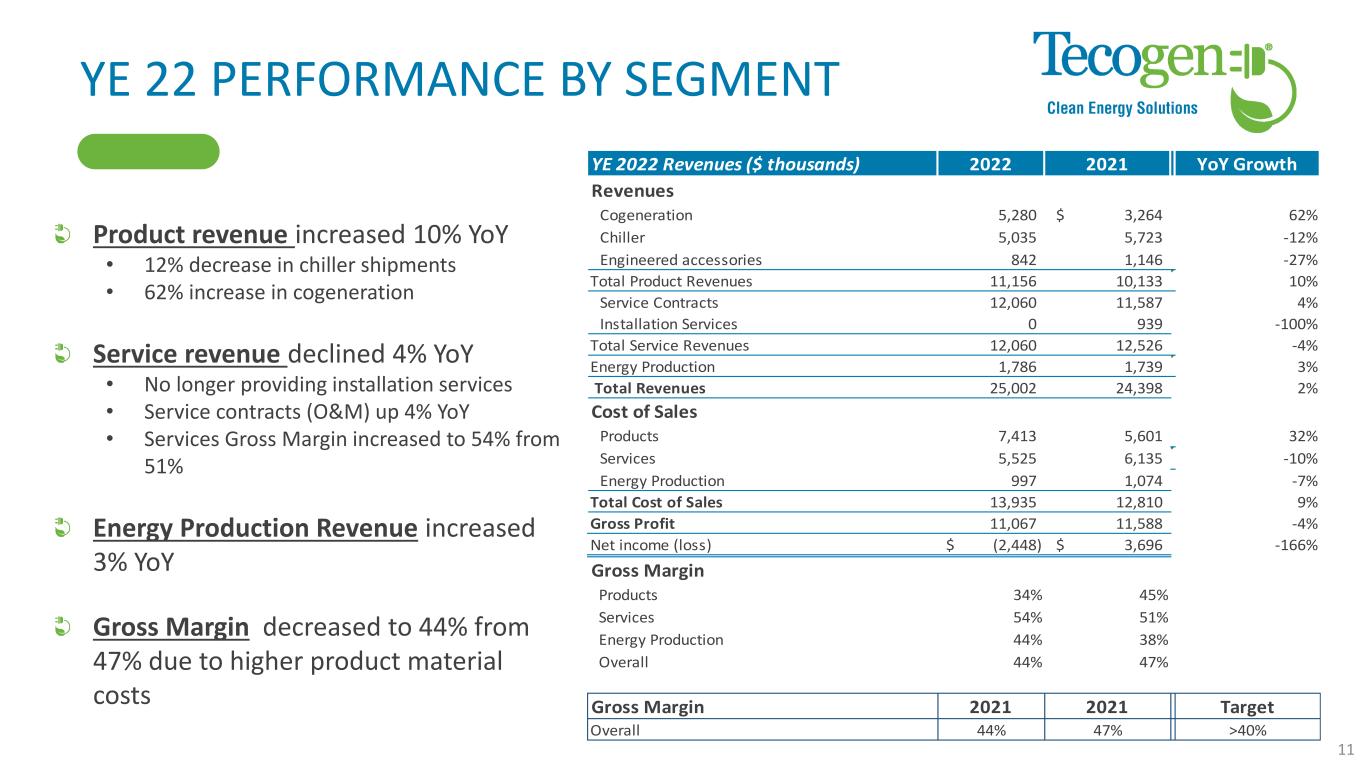
YE 22 PERFORMANCE BY SEGMENT Product revenue increased 10% YoY • 12% decrease in chiller shipments • 62% increase in cogeneration Service revenue declined 4% YoY • No longer providing installation services • Service contracts (O&M) up 4% YoY • Services Gross Margin increased to 54% from 51% Energy Production Revenue increased 3% YoY Gross Margin decreased to 44% from 47% due to higher product material costs 11 YE 2022 Revenues ($ thousands) 2022 2021 YoY Growth Revenues Cogeneration 5,280 3,264$ 62% Chiller 5,035 5,723 -12% Engineered accessories 842 1,146 -27% Total Product Revenues 11,156 10,133 10% Service Contracts 12,060 11,587 4% Installation Services 0 939 -100% Total Service Revenues 12,060 12,526 -4% Energy Production 1,786 1,739 3% Total Revenues 25,002 24,398 2% Cost of Sales Products 7,413 5,601 32% Services 5,525 6,135 -10% Energy Production 997 1,074 -7% Total Cost of Sales 13,935 12,810 9% Gross Profit 11,067 11,588 -4% Net income (loss) (2,448)$ 3,696$ -166% Gross Margin Products 34% 45% Services 54% 51% Energy Production 44% 38% Overall 44% 47% Gross Margin 2021 2021 Target Overall 44% 47% >40%

BACKLOG AND CASH Backlog has increased from year end to $7.58m from $6.6m Cash position $1.9m at quarter end and $2.2m presently No Debt Multi-Family Residential 48% Controlled Environment Agriculture 29% Other 23% Backlog by Customer Type 12
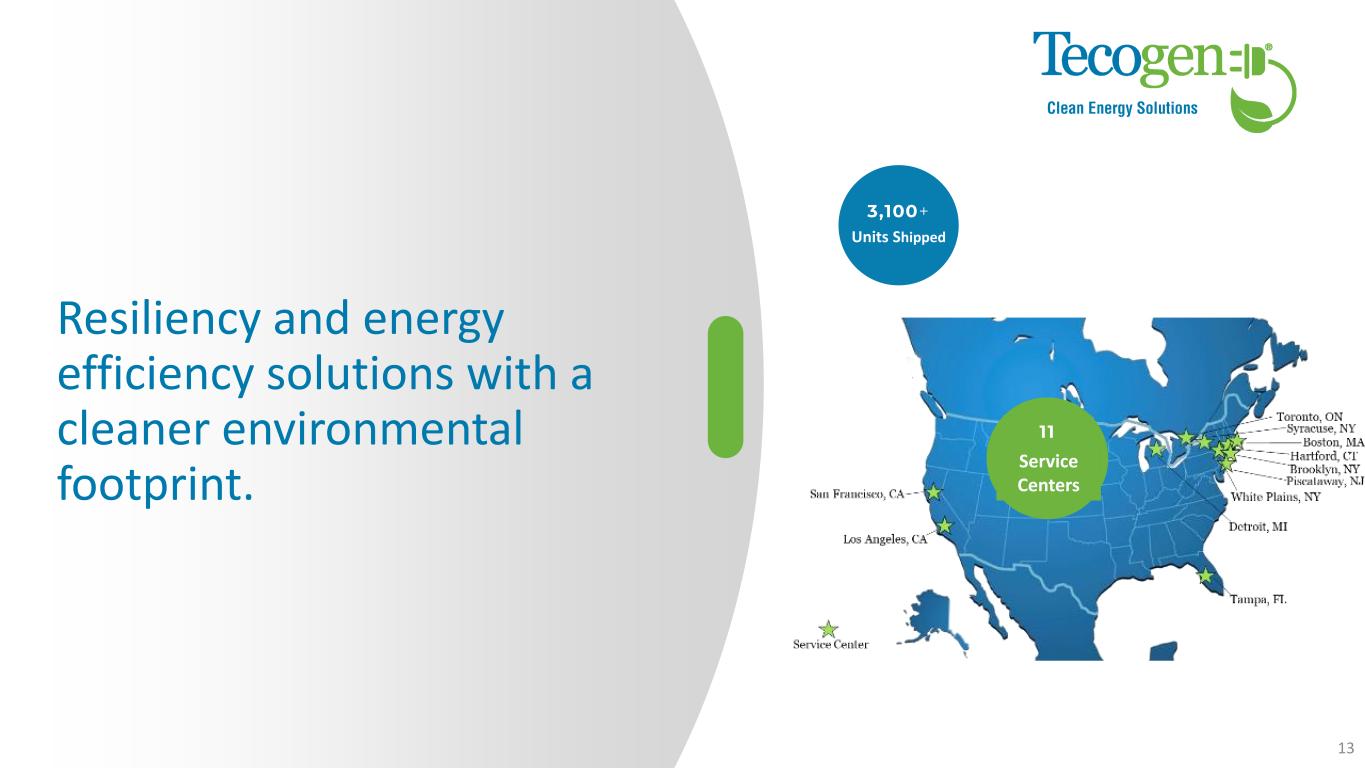
Resiliency and energy efficiency solutions with a cleaner environmental footprint. 13 Units Shipped Service Centers
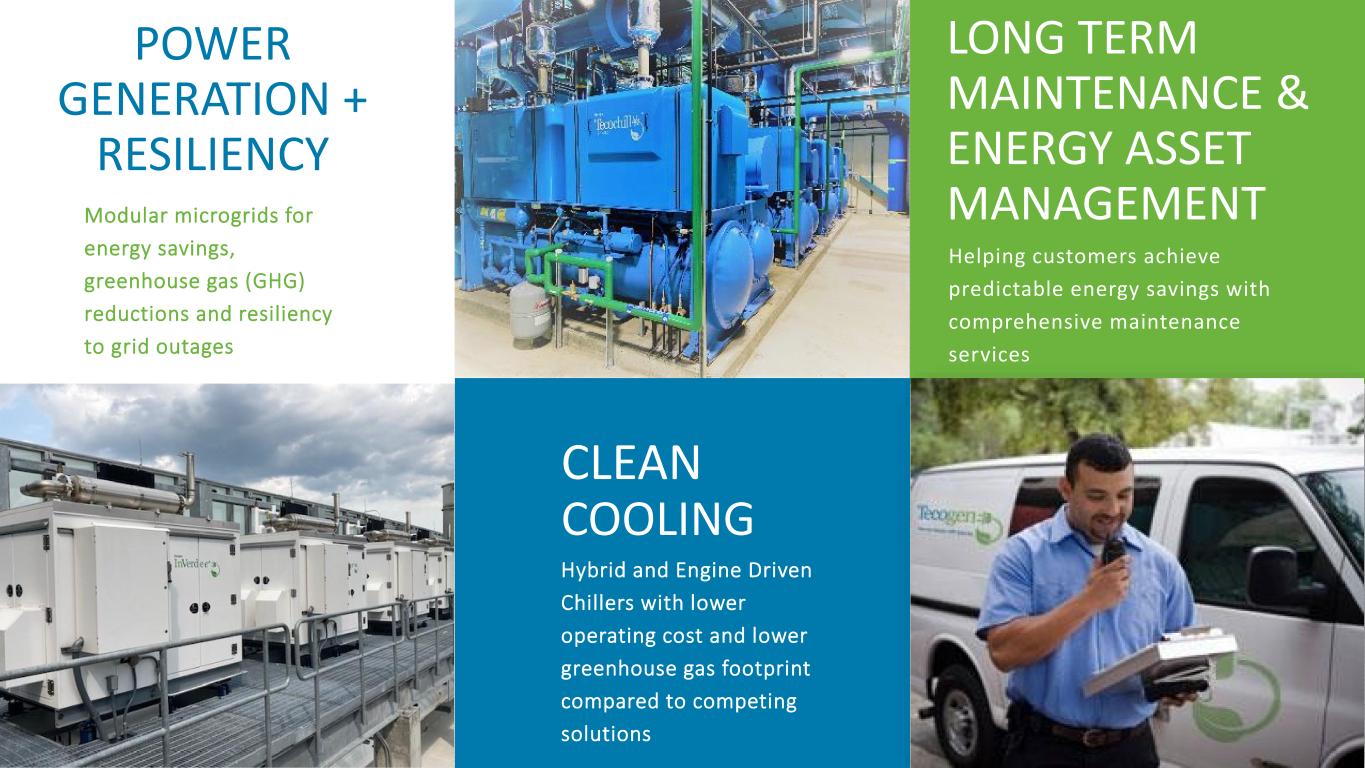
POWER GENERATION + RESILIENCY CLEAN COOLING Hybrid and Engine Driven Chillers with lower operating cost and lower greenhouse gas footprint compared to competing solutions LONG TERM MAINTENANCE & ENERGY ASSET MANAGEMENTModular microgrids for energy savings, greenhouse gas (GHG) reductions and resiliency to grid outages Helping customers achieve predictable energy savings with comprehensive maintenance services
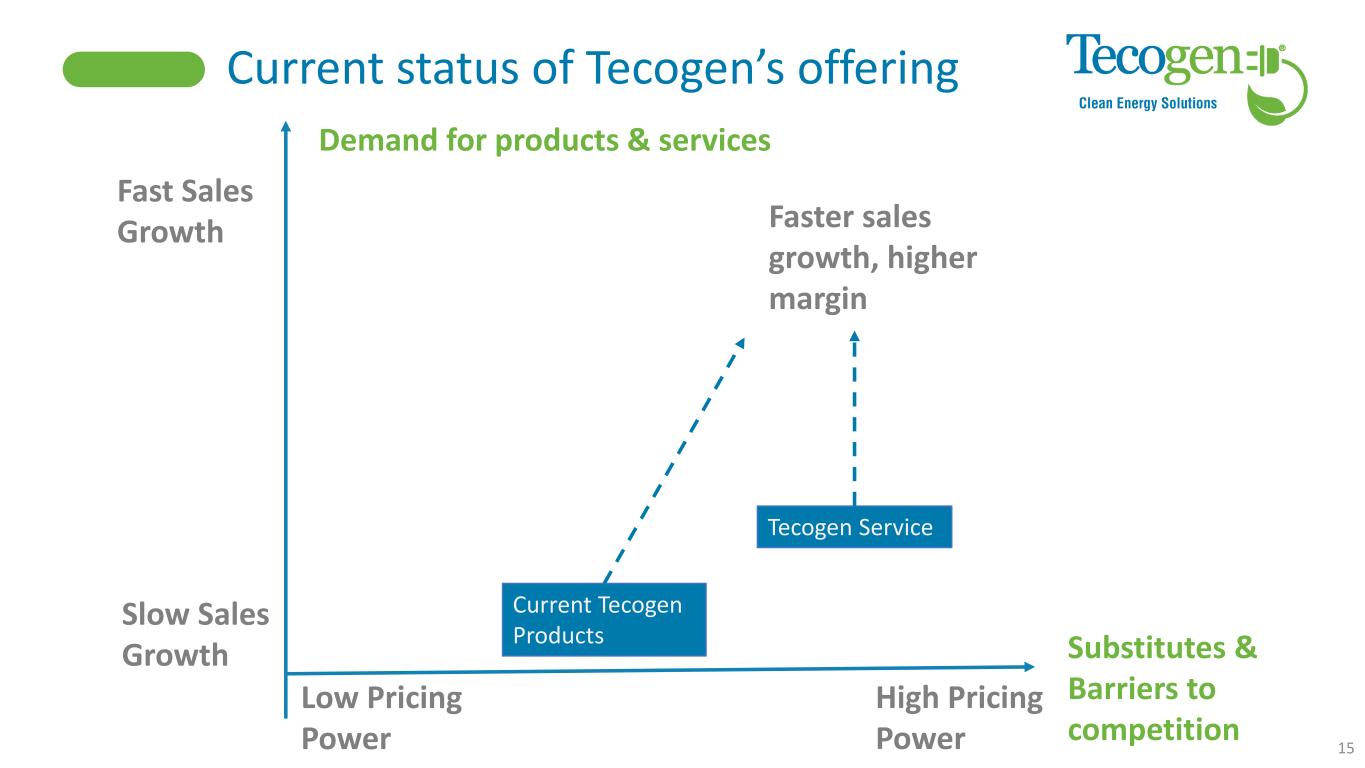
Current status of Tecogen’s offering Substitutes & Barriers to competition 15 Demand for products & services Faster sales growth, higher margin Tecogen Service Current Tecogen Products Low Pricing Power High Pricing Power Slow Sales Growth Fast Sales Growth

Tecogen Growth Plan • Phase 1 – Stabilize existing business • Cost control measures and focus on key markets • Free up cash from inventory and NYSERDA rebates • In process of assuming service agreements for 202 cogeneration units • Obtain PO for first air-cooled chillers sites • Phase 2 – Position company for scalability • Test and refine business model to sell via strategic partnerships • Improve ease of install of products and documentation • Add additional service contracts • Start functional testing and build up back log for air-cooled chiller • Phase 3 – Ramp up hybrid cooling products and service offerings • Start full scale production of air-cooled chiller • Expand service offerings to include other equipment such as electric chillers and provide energy management services for larger asset managers • Look to expand hybrid product range to heat pumps and compressors 16 By Aug 2023 By Nov 2023 By Jan 2024

Market Segments Multi-unit residential 29% Education 15% Other 6% Indoor growing 27% Industrial 1% Hospital 8% Hotel 4% Office 7% Recreational 1% Nursing Home 2% Lab 0% ✓ Focus sales efforts on segments with largest advantages against competing offerings ✓ Indoor Agriculture ✓ Education ✓ Multi-Family ✓ Healthcare 17

Competitive Landscape Cogeneration Easy to Install, Quiet and fits in tight spaces Efficiency/ROI Easy Difficult ✓ Tecogen has an advantage in buildings that need a quiet, easy to fit cogeneration system ✓ Higher efficiency large industrial cogeneration systems won’t fit in most high-rise buildings and are too noisy ✓ 75 KW to 1MW size range ✓ Focus on buildings in urban environments 18

Competitive Landscape Chillers Cost of Operation Electrical Capacity Needed High Low High Low ✓ Tecogen has advantages in buildings that have electrical capacity constraints or have better uses for the electrical capacity ✓ Best ROI in buildings that cool and dehumidify at the same time ✓ Focus on indoor agriculture, healthcare, industrial where both conditions above are met 19

Education , $208,208,000 Food, $86,520,000 Beverage, $10,360,000 Hospital, $147,840,000 Nursing, $134,848,000 Fitness, $105,168,000 Multifamily (NY, NJ, NewE), $194,541,760 Addressable Market Size in New England, NY, NJ, FL, CA ✓ Addressable market is still large in present geographies ✓ Utility rates are going up in our core markets ✓ Addressable Market >$1Bn 20
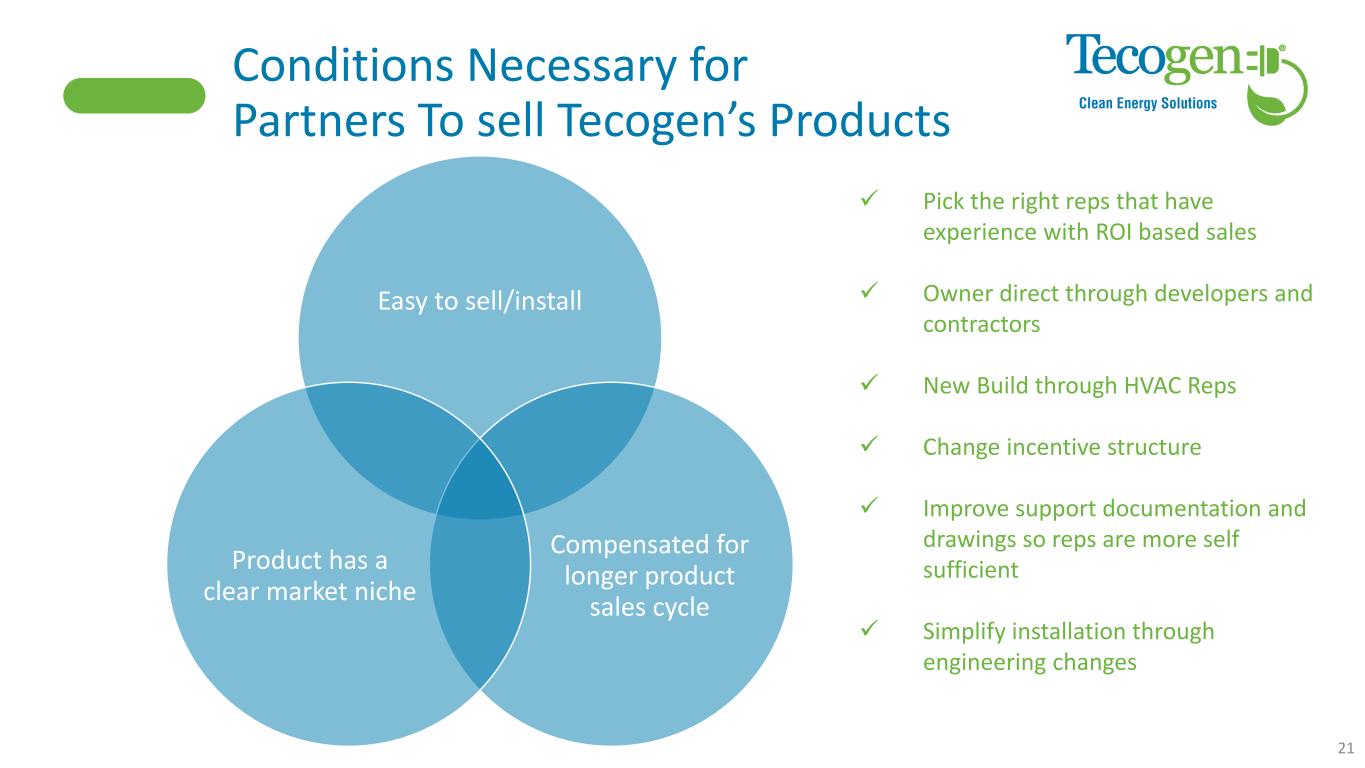
Conditions Necessary for Partners To sell Tecogen’s Products Easy to sell/install Compensated for longer product sales cycle Product has a clear market niche ✓ Pick the right reps that have experience with ROI based sales ✓ Owner direct through developers and contractors ✓ New Build through HVAC Reps ✓ Change incentive structure ✓ Improve support documentation and drawings so reps are more self sufficient ✓ Simplify installation through engineering changes 21
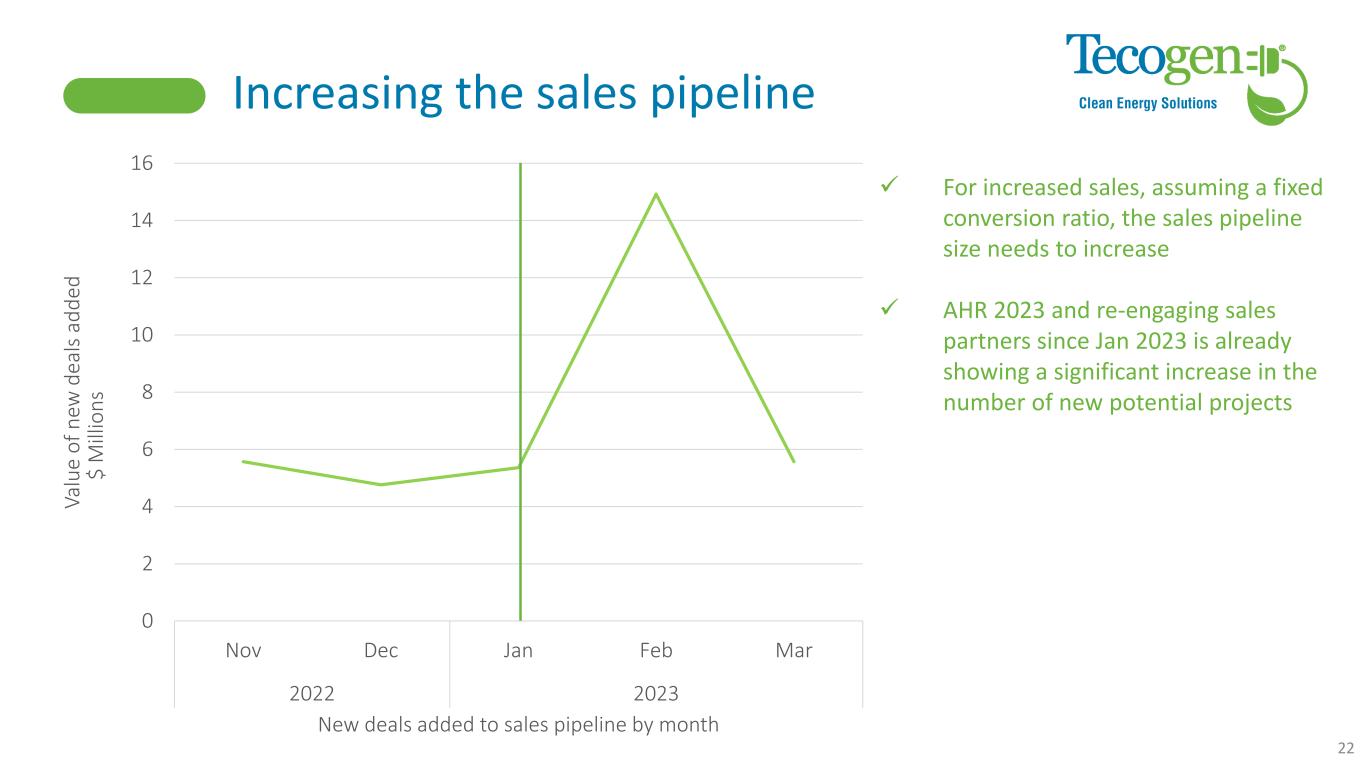
0 2 4 6 8 10 12 14 16 Nov Dec Jan Feb Mar 2022 2023 Va lu e o f n ew d ea ls a d d ed $ M ill io n s New deals added to sales pipeline by month Increasing the sales pipeline 22 ✓ For increased sales, assuming a fixed conversion ratio, the sales pipeline size needs to increase ✓ AHR 2023 and re-engaging sales partners since Jan 2023 is already showing a significant increase in the number of new potential projects
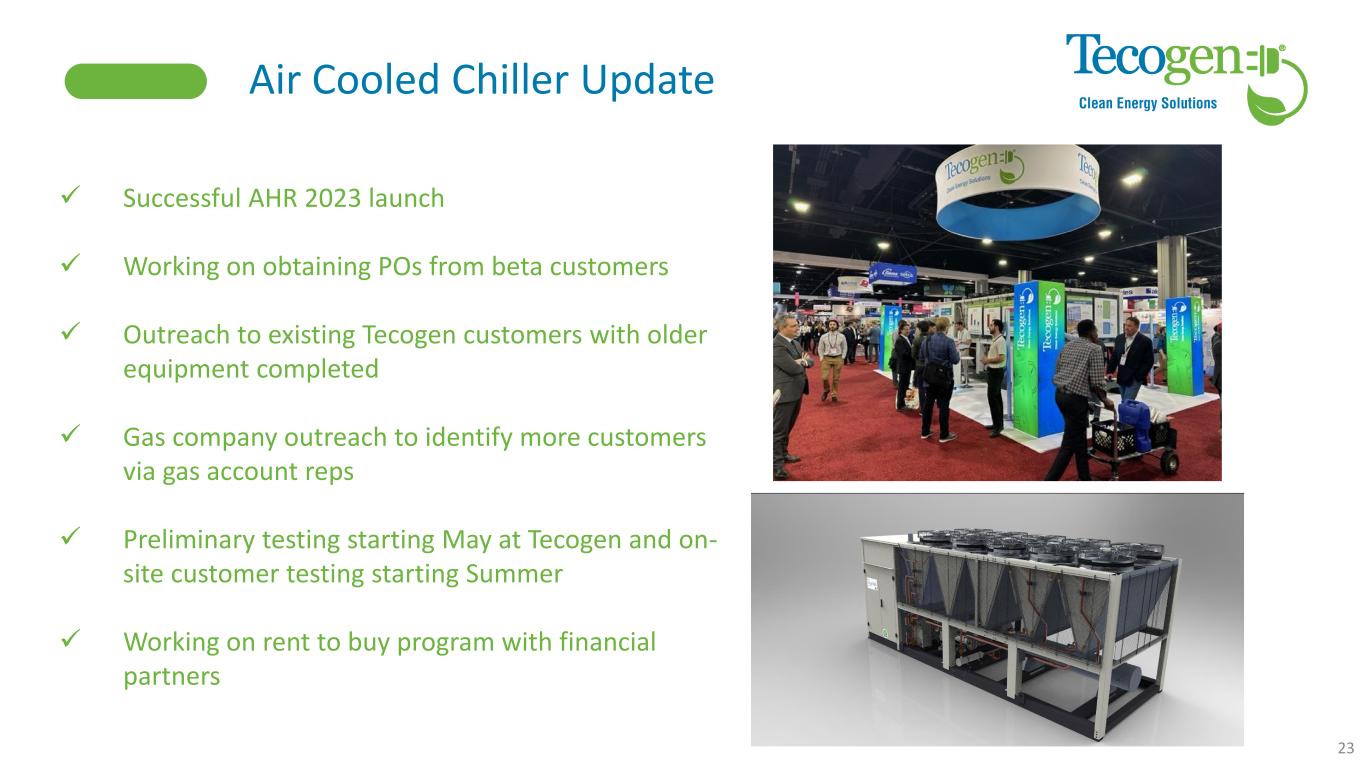
Air Cooled Chiller Update ✓ Successful AHR 2023 launch ✓ Working on obtaining POs from beta customers ✓ Outreach to existing Tecogen customers with older equipment completed ✓ Gas company outreach to identify more customers via gas account reps ✓ Preliminary testing starting May at Tecogen and on- site customer testing starting Summer ✓ Working on rent to buy program with financial partners 23
SUMMARY AND Q&A Company Information Tecogen, Inc 45 First Ave Waltham, MA 02451 www.Tecogen.com Contact information Abinand Rangesh, CEO 781.466.6487 Abinand.rangesh@Tecogen.com 24 ✓ Free up cash and stabilize business ✓ Grow service division ✓ Make products easier to install and sell ✓ Put in a sales distribution system via the right channel partners & developers ✓ Build up the backlog for the Air-Cooled chiller