00015374352022FYfalseP3Yhttp://fasb.org/us-gaap/2021-01-31#OtherLiabilitiesCurrenthttp://fasb.org/us-gaap/2021-01-31#OtherLiabilitiesCurrenthttp://fasb.org/us-gaap/2021-01-31#OtherLiabilitiesNoncurrenthttp://fasb.org/us-gaap/2021-01-31#OtherLiabilitiesNoncurrenthttp://fasb.org/us-gaap/2021-01-31#UnrealizedGainLossOnInvestments00015374352022-01-012022-12-3100015374352022-06-30iso4217:USD00015374352023-03-16xbrli:shares00015374352022-12-3100015374352021-12-31iso4217:USDxbrli:shares0001537435us-gaap:ProductMember2022-01-012022-12-310001537435us-gaap:ProductMember2021-01-012021-12-310001537435us-gaap:ServiceMember2022-01-012022-12-310001537435us-gaap:ServiceMember2021-01-012021-12-310001537435us-gaap:EnergyServiceMember2022-01-012022-12-310001537435us-gaap:EnergyServiceMember2021-01-012021-12-3100015374352021-01-012021-12-310001537435tgen:BenefitforIncomeTaxesMember2022-01-012022-12-310001537435us-gaap:CommonStockMember2020-12-310001537435us-gaap:AdditionalPaidInCapitalMember2020-12-310001537435us-gaap:RetainedEarningsMember2020-12-310001537435us-gaap:NoncontrollingInterestMember2020-12-3100015374352020-12-310001537435us-gaap:NoncontrollingInterestMember2021-01-012021-12-310001537435us-gaap:AdditionalPaidInCapitalMember2021-01-012021-12-310001537435us-gaap:RetainedEarningsMember2021-01-012021-12-310001537435us-gaap:CommonStockMember2021-12-310001537435us-gaap:AdditionalPaidInCapitalMember2021-12-310001537435us-gaap:RetainedEarningsMember2021-12-310001537435us-gaap:NoncontrollingInterestMember2021-12-310001537435us-gaap:NoncontrollingInterestMember2022-01-012022-12-310001537435us-gaap:AdditionalPaidInCapitalMember2022-01-012022-12-310001537435us-gaap:RetainedEarningsMember2022-01-012022-12-310001537435us-gaap:CommonStockMember2022-12-310001537435us-gaap:AdditionalPaidInCapitalMember2022-12-310001537435us-gaap:RetainedEarningsMember2022-12-310001537435us-gaap:NoncontrollingInterestMember2022-12-31tgen:segmentxbrli:pure00015374352022-04-142022-04-140001537435us-gaap:SubsequentEventMember2023-01-122023-01-120001537435srt:ScenarioForecastMember2023-04-012023-06-300001537435us-gaap:CustomerConcentrationRiskMemberus-gaap:SalesRevenueNetMember2022-01-012022-12-31tgen:customer0001537435us-gaap:CustomerConcentrationRiskMemberus-gaap:SalesRevenueNetMember2021-01-012021-12-310001537435us-gaap:CustomerConcentrationRiskMemberus-gaap:AccountsReceivableMember2022-01-012022-12-310001537435us-gaap:CustomerConcentrationRiskMemberus-gaap:AccountsReceivableMember2021-01-012021-12-310001537435srt:MinimumMember2022-01-012022-12-310001537435srt:MaximumMember2022-01-012022-12-310001537435us-gaap:GeneralAndAdministrativeExpenseMember2022-01-012022-12-310001537435us-gaap:GeneralAndAdministrativeExpenseMember2021-01-012021-12-310001537435tgen:ProductsSegmentMemberus-gaap:ProductMember2022-01-012022-12-310001537435us-gaap:ProductMembertgen:ServicesSegmentMember2022-01-012022-12-310001537435tgen:EnergyProductionSegmentMemberus-gaap:ProductMember2022-01-012022-12-310001537435tgen:InstallationServicesMembertgen:ProductsSegmentMember2022-01-012022-12-310001537435tgen:InstallationServicesMembertgen:ServicesSegmentMember2022-01-012022-12-310001537435tgen:InstallationServicesMembertgen:EnergyProductionSegmentMember2022-01-012022-12-310001537435tgen:InstallationServicesMember2022-01-012022-12-310001537435tgen:ProductsSegmentMembertgen:MaintenanceServiceMember2022-01-012022-12-310001537435tgen:MaintenanceServiceMembertgen:ServicesSegmentMember2022-01-012022-12-310001537435tgen:EnergyProductionSegmentMembertgen:MaintenanceServiceMember2022-01-012022-12-310001537435tgen:MaintenanceServiceMember2022-01-012022-12-310001537435tgen:ProductsSegmentMembertgen:EnergyProductionMember2022-01-012022-12-310001537435tgen:EnergyProductionMembertgen:ServicesSegmentMember2022-01-012022-12-310001537435tgen:EnergyProductionSegmentMember2022-01-012022-12-310001537435tgen:EnergyProductionMember2022-01-012022-12-310001537435tgen:ProductsSegmentMemberus-gaap:OperatingSegmentsMember2022-01-012022-12-310001537435tgen:ServicesSegmentMember2022-01-012022-12-310001537435tgen:EnergyProductionSegmentMemberus-gaap:OperatingSegmentsMember2022-01-012022-12-310001537435tgen:ProductsSegmentMemberus-gaap:ProductMember2021-01-012021-12-310001537435us-gaap:ProductMembertgen:ServicesSegmentMember2021-01-012021-12-310001537435tgen:EnergyProductionSegmentMemberus-gaap:ProductMember2021-01-012021-12-310001537435tgen:InstallationServicesMembertgen:ProductsSegmentMember2021-01-012021-12-310001537435tgen:InstallationServicesMembertgen:ServicesSegmentMember2021-01-012021-12-310001537435tgen:InstallationServicesMembertgen:EnergyProductionSegmentMember2021-01-012021-12-310001537435tgen:InstallationServicesMember2021-01-012021-12-310001537435tgen:ProductsSegmentMembertgen:MaintenanceServiceMember2021-01-012021-12-310001537435tgen:MaintenanceServiceMembertgen:ServicesSegmentMember2021-01-012021-12-310001537435tgen:EnergyProductionSegmentMembertgen:MaintenanceServiceMember2021-01-012021-12-310001537435tgen:MaintenanceServiceMember2021-01-012021-12-310001537435tgen:ProductsSegmentMembertgen:EnergyProductionMember2021-01-012021-12-310001537435tgen:EnergyProductionMembertgen:ServicesSegmentMember2021-01-012021-12-310001537435tgen:EnergyProductionSegmentMember2021-01-012021-12-310001537435tgen:EnergyProductionMember2021-01-012021-12-310001537435tgen:ProductsSegmentMemberus-gaap:OperatingSegmentsMember2021-01-012021-12-310001537435tgen:ServicesSegmentMember2021-01-012021-12-310001537435tgen:EnergyProductionSegmentMemberus-gaap:OperatingSegmentsMember2021-01-012021-12-310001537435tgen:TurnkeyInstallationMember2022-01-012022-12-310001537435us-gaap:EmployeeStockOptionMember2022-01-012022-12-310001537435us-gaap:EmployeeStockOptionMember2021-01-012021-12-310001537435tgen:AmericanDgEnergyMember2017-05-182017-05-180001537435tgen:AmericanDgEnergyMember2017-05-1800015374352017-05-1800015374352021-01-012021-03-310001537435tgen:EnergyProductionContactsMember2022-01-012022-12-310001537435tgen:ProductCertificationMember2022-01-012022-12-310001537435tgen:ProductCertificationMember2021-01-012021-12-310001537435us-gaap:PatentsMembersrt:MinimumMember2022-01-012022-12-310001537435us-gaap:PatentsMembersrt:MaximumMember2022-01-012022-12-310001537435us-gaap:PatentsMember2022-01-012022-12-310001537435us-gaap:PatentsMember2021-01-012021-12-310001537435tgen:ProductCertificationMember2022-12-310001537435tgen:ProductCertificationMember2021-12-310001537435us-gaap:PatentsMember2022-12-310001537435us-gaap:PatentsMember2021-12-310001537435us-gaap:DevelopedTechnologyRightsMember2022-12-310001537435us-gaap:DevelopedTechnologyRightsMember2021-12-310001537435us-gaap:TrademarksMember2022-12-310001537435us-gaap:TrademarksMember2021-12-310001537435us-gaap:InProcessResearchAndDevelopmentMember2022-12-310001537435us-gaap:InProcessResearchAndDevelopmentMember2021-12-310001537435tgen:FavorableContractAssetMember2022-12-310001537435tgen:FavorableContractAssetMember2021-12-310001537435tgen:UnfavorableContractLiabilityMember2022-12-310001537435tgen:UnfavorableContractLiabilityMember2021-12-310001537435tgen:LongLivedAssetImpairmentMember2022-01-012022-12-310001537435tgen:ContractAssetandLiabilityMembertgen:NoncontractRelatedIntangibleAssetsMember2022-12-310001537435us-gaap:ContractBasedIntangibleAssetsMembertgen:ContractAssetandLiabilityMember2022-12-310001537435tgen:ContractAssetandLiabilityMember2022-12-310001537435us-gaap:EnergyEquipmentMembersrt:MinimumMember2022-01-012022-12-310001537435us-gaap:EnergyEquipmentMembersrt:MaximumMember2022-01-012022-12-310001537435us-gaap:EnergyEquipmentMember2022-12-310001537435us-gaap:EnergyEquipmentMember2021-12-310001537435srt:MinimumMemberus-gaap:MachineryAndEquipmentMember2022-01-012022-12-310001537435srt:MaximumMemberus-gaap:MachineryAndEquipmentMember2022-01-012022-12-310001537435us-gaap:MachineryAndEquipmentMember2022-12-310001537435us-gaap:MachineryAndEquipmentMember2021-12-310001537435us-gaap:FurnitureAndFixturesMember2022-01-012022-12-310001537435us-gaap:FurnitureAndFixturesMember2022-12-310001537435us-gaap:FurnitureAndFixturesMember2021-12-310001537435srt:MinimumMemberus-gaap:ComputerSoftwareIntangibleAssetMember2022-01-012022-12-310001537435us-gaap:ComputerSoftwareIntangibleAssetMembersrt:MaximumMember2022-01-012022-12-310001537435us-gaap:ComputerSoftwareIntangibleAssetMember2022-12-310001537435us-gaap:ComputerSoftwareIntangibleAssetMember2021-12-310001537435us-gaap:LeaseholdImprovementsMember2022-12-310001537435us-gaap:LeaseholdImprovementsMember2021-12-310001537435tgen:ProductsandServicesMember2020-12-310001537435tgen:EnergyProductionMember2020-12-310001537435tgen:ProductsandServicesMember2021-01-012021-12-310001537435tgen:EnergyProductionMember2021-01-012021-12-310001537435tgen:ProductsandServicesMember2021-12-310001537435tgen:EnergyProductionMember2021-12-310001537435tgen:ProductsandServicesMember2022-01-012022-12-310001537435tgen:EnergyProductionMember2022-01-012022-12-310001537435tgen:ProductsandServicesMember2022-12-310001537435tgen:EnergyProductionMember2022-12-310001537435tgen:WebsterBusinessCreditCorporationMembertgen:PPPLoanProgramMember2020-04-170001537435tgen:WebsterBusinessCreditCorporationMembertgen:PPPLoanProgramMember2021-01-112021-01-110001537435tgen:WebsterBusinessCreditCorporationMembertgen:PPPLoanProgramMember2021-01-110001537435tgen:WebsterBusinessCreditCorporationMembertgen:PPPLoanProgramMember2021-02-050001537435tgen:WebsterBusinessCreditCorporationMembertgen:PPPLoanProgramMember2021-09-082021-09-080001537435tgen:WebsterBusinessCreditCorporationMembertgen:PPPLoanProgramMember2021-09-0800015374352020-07-092020-07-090001537435tgen:OfficeSpaceAndWarehouseFacilitiesMember2022-01-012022-12-310001537435tgen:OfficeSpaceAndWarehouseFacilitiesMember2021-01-012021-12-3100015374352013-02-130001537435srt:ParentCompanyMembertgen:AmendnedStockOptionAndIncentivePlan2006Memberus-gaap:EmployeeStockOptionMember2022-12-310001537435srt:ParentCompanyMembertgen:AmendnedStockOptionAndIncentivePlan2006Memberus-gaap:EmployeeStockOptionMember2021-12-310001537435srt:ParentCompanyMember2022-01-012022-12-310001537435srt:ParentCompanyMember2021-01-012021-12-310001537435tgen:A2022StockIncentivePlanMembersrt:ParentCompanyMemberus-gaap:EmployeeStockOptionMember2022-06-090001537435srt:ParentCompanyMembersrt:DirectorMember2022-01-012022-12-310001537435srt:ParentCompanyMembersrt:DirectorMember2021-01-012021-12-310001537435tgen:A2022StockIncentivePlanMembersrt:ParentCompanyMemberus-gaap:EmployeeStockOptionMember2022-12-310001537435srt:ParentCompanyMember2021-12-310001537435srt:ParentCompanyMemberus-gaap:EmployeeStockOptionMember2021-01-012021-12-310001537435srt:ParentCompanyMember2022-12-310001537435srt:ParentCompanyMemberus-gaap:EmployeeStockOptionMember2022-01-012022-12-310001537435us-gaap:EstimateOfFairValueFairValueDisclosureMembertgen:EurositePowerIncMemberus-gaap:FairValueMeasurementsRecurringMember2022-12-310001537435tgen:EurositePowerIncMemberus-gaap:FairValueInputsLevel1Memberus-gaap:FairValueMeasurementsRecurringMember2022-12-310001537435tgen:EurositePowerIncMemberus-gaap:FairValueInputsLevel2Memberus-gaap:FairValueMeasurementsRecurringMember2022-12-310001537435tgen:EurositePowerIncMemberus-gaap:FairValueInputsLevel3Memberus-gaap:FairValueMeasurementsRecurringMember2022-12-310001537435tgen:EurositePowerIncMemberus-gaap:FairValueMeasurementsRecurringMember2022-01-012022-12-310001537435us-gaap:EstimateOfFairValueFairValueDisclosureMemberus-gaap:FairValueMeasurementsRecurringMember2022-12-310001537435us-gaap:FairValueInputsLevel1Memberus-gaap:FairValueMeasurementsRecurringMember2022-12-310001537435us-gaap:FairValueInputsLevel2Memberus-gaap:FairValueMeasurementsRecurringMember2022-12-310001537435us-gaap:FairValueInputsLevel3Memberus-gaap:FairValueMeasurementsRecurringMember2022-12-310001537435us-gaap:FairValueMeasurementsRecurringMember2022-01-012022-12-310001537435us-gaap:EstimateOfFairValueFairValueDisclosureMembertgen:EurositePowerIncMemberus-gaap:FairValueMeasurementsRecurringMember2021-12-310001537435tgen:EurositePowerIncMemberus-gaap:FairValueInputsLevel1Memberus-gaap:FairValueMeasurementsRecurringMember2021-12-310001537435tgen:EurositePowerIncMemberus-gaap:FairValueInputsLevel2Memberus-gaap:FairValueMeasurementsRecurringMember2021-12-310001537435tgen:EurositePowerIncMemberus-gaap:FairValueInputsLevel3Memberus-gaap:FairValueMeasurementsRecurringMember2021-12-310001537435tgen:EurositePowerIncMemberus-gaap:FairValueMeasurementsRecurringMember2021-01-012021-12-310001537435us-gaap:EstimateOfFairValueFairValueDisclosureMemberus-gaap:FairValueMeasurementsRecurringMember2021-12-310001537435us-gaap:FairValueInputsLevel1Memberus-gaap:FairValueMeasurementsRecurringMember2021-12-310001537435us-gaap:FairValueInputsLevel2Memberus-gaap:FairValueMeasurementsRecurringMember2021-12-310001537435us-gaap:FairValueInputsLevel3Memberus-gaap:FairValueMeasurementsRecurringMember2021-12-310001537435us-gaap:FairValueMeasurementsRecurringMember2021-01-012021-12-310001537435us-gaap:EstimateOfFairValueFairValueDisclosureMemberus-gaap:FairValueMeasurementsRecurringMember2020-12-310001537435tgen:ServicesAndOtherSegmentMemberus-gaap:OperatingSegmentsMember2022-01-012022-12-310001537435tgen:EnergyProductionMemberus-gaap:OperatingSegmentsMember2022-01-012022-12-310001537435us-gaap:OperatingSegmentsMemberus-gaap:CorporateAndOtherMember2022-01-012022-12-310001537435us-gaap:OperatingSegmentsMember2022-01-012022-12-310001537435us-gaap:IntersegmentEliminationMembertgen:ProductsSegmentMember2022-01-012022-12-310001537435us-gaap:IntersegmentEliminationMembertgen:ServicesAndOtherSegmentMember2022-01-012022-12-310001537435us-gaap:IntersegmentEliminationMembertgen:EnergyProductionMember2022-01-012022-12-310001537435us-gaap:IntersegmentEliminationMemberus-gaap:CorporateAndOtherMember2022-01-012022-12-310001537435us-gaap:IntersegmentEliminationMember2022-01-012022-12-310001537435tgen:ProductsSegmentMember2022-01-012022-12-310001537435tgen:ServicesAndOtherSegmentMember2022-01-012022-12-310001537435us-gaap:CorporateAndOtherMember2022-01-012022-12-310001537435tgen:ProductsSegmentMember2022-12-310001537435tgen:ServicesAndOtherSegmentMember2022-12-310001537435us-gaap:CorporateAndOtherMember2022-12-310001537435tgen:ServicesAndOtherSegmentMemberus-gaap:OperatingSegmentsMember2021-01-012021-12-310001537435tgen:EnergyProductionMemberus-gaap:OperatingSegmentsMember2021-01-012021-12-310001537435us-gaap:OperatingSegmentsMemberus-gaap:CorporateAndOtherMember2021-01-012021-12-310001537435us-gaap:OperatingSegmentsMember2021-01-012021-12-310001537435us-gaap:IntersegmentEliminationMembertgen:ProductsSegmentMember2021-01-012021-12-310001537435us-gaap:IntersegmentEliminationMembertgen:ServicesAndOtherSegmentMember2021-01-012021-12-310001537435us-gaap:IntersegmentEliminationMembertgen:EnergyProductionMember2021-01-012021-12-310001537435us-gaap:IntersegmentEliminationMemberus-gaap:CorporateAndOtherMember2021-01-012021-12-310001537435us-gaap:IntersegmentEliminationMember2021-01-012021-12-310001537435tgen:ProductsSegmentMember2021-01-012021-12-310001537435tgen:ServicesAndOtherSegmentMember2021-01-012021-12-310001537435us-gaap:CorporateAndOtherMember2021-01-012021-12-310001537435tgen:ProductsSegmentMember2021-12-310001537435tgen:ServicesAndOtherSegmentMember2021-12-310001537435us-gaap:CorporateAndOtherMember2021-12-310001537435tgen:BenefitforIncomeTaxesMember2021-01-012021-12-310001537435us-gaap:InternalRevenueServiceIRSMember2022-12-310001537435us-gaap:StateAndLocalJurisdictionMember2022-12-310001537435tgen:AmericanDgEnergyMember2019-01-012019-12-310001537435tgen:AmericanDgEnergyMember2022-01-012022-12-31
UNITED STATES
SECURITIES AND EXCHANGE COMMISSION
Washington, DC 20549
FORM 10-K
| | | | | | | | |
| ☑ | | ANNUAL REPORT PURSUANT TO SECTION 13 OR 15(d) OF THE SECURITIES EXCHANGE ACT OF 1934 |
For the fiscal year ended December 31, 2022
or
| | | | | | | | |
| ☐ | | TRANSITION REPORT PURSUANT TO SECTION 13 OR 15(d) OF THE SECURITIES EXCHANGE ACT OF 1934 |
Commission file number 001-36103
TECOGEN INC.
(Exact name of Registrant as specified in its charter)
| | | | | |
| Delaware | 04-3536131 |
| (State or Other Jurisdiction of Incorporation or Organization) | (IRS Employer Identification No.) |
| | | | | |
| 45 First Avenue | |
Waltham, Massachusetts 02451 | (781) 466-6400 |
| (Address of Principal Executive Offices and Zip Code) | Registrant's telephone number, including area code |
Securities registered pursuant to Section 12(g) of the Securities Exchange Act: Common Stock, $.001 par value per share
Indicate by check mark if the registrant is a well-known seasoned issuer, as defined in Rule 405 of the Securities Act.Yes ¨ No ý
Indicate by check mark if the registrant is not required to file reports pursuant to Section 13 or Section 15(d) of the Act. Yes ¨ No ý
Indicate by check mark whether the registrant (1) has filed all reports required to be filed by Section 13 or 15(d) of the Securities Exchange Act of 1934 during the preceding 12 months (or for such shorter period that the registrant was required to file such reports), and (2) has been subject to such filing requirements for the past 90 days. Yes ý No ¨
Indicate by check mark whether the registrant has submitted electronically every Interactive Data File required to be submitted pursuant to Rule 405 of Regulation S-T (§232.405 of this chapter) during the preceding 12 months (or for such shorter period that the registrant was required to submit such files). Yes ý No ¨
Indicate by check mark whether the registrant is a large accelerated filer, an accelerated filer, a non-accelerated filer, a smaller reporting company or an emerging growth company. See the definitions of “large accelerated filer”, “accelerated filer”, “smaller reporting company” and "emerging growth company" in Rule 12b-2 of the Exchange Act.
Large accelerated filer ☐ Accelerated filer o
Non–Accelerated Filer ☒ Smaller reporting company ☒
Emerging growth company ☐
If an emerging growth company, indicate by check mark if the registrant has elected not to use the extended transition period for complying with any new or revised financial accounting standards provided pursuant to Section 13(a) of the Exchange Act. ¨
Indicate by check mark whether the registrant has filed a report on and attestation to its management’s assessment of the effectiveness of its internal control over financial reporting under Section 404(b) of the Sarbanes-Oxley Act (15 U.S.C. 7262(b)) by the registered public accounting firm that prepared or issued its audit report. Yes ☐ No ☒
Indicate by check mark whether the registrant is a shell company (as defined in Rule 12b-2 of the Act).Yes ☐ No ý
As of June 30, 2022, the last day of the registrant’s most recently completed second fiscal quarter, the aggregate market value of the voting and non-voting common equity held by non-affiliates was: $17,403,980. Solely for purposes of this disclosure, shares of common stock held by executive officers and directors of the registrant as of such date have been excluded because such persons may be deemed to be affiliates. This determination of executive officers and directors as affiliates is not necessarily a conclusive determination for any other purposes.
As of March 23, 2023, 24,850,261 shares of common stock, $.001 par value per share, of the registrant were issued and outstanding.
DOCUMENTS INCORPORATED BY REFERENCE
Certain information required for Part III of this Annual Report on Form 10-K is incorporated by reference to Tecogen Inc.'s definitive proxy statement for its 2022 Annual Meeting of Stockholders which will be filed with the Securities and Exchange Commission ("SEC") pursuant to Regulation 14A under the Securities Act of 1934, as amended, within 120 days following its fiscal year ended December 31, 2022.
CAUTIONARY NOTE CONCERNING FORWARD-LOOKING STATEMENTS
This Annual Report on Form 10-K and the documents incorporated herein by reference contain forward-looking statements within the meaning of Section 27A of the Securities Act of 1933, as amended (“Securities Act”), Section 21E of the Securities Exchange Act of 1934, as amended (“Securities Exchange Act”), the Private Securities Litigation Reform Act of 1995 and other federal securities laws that involve a number of risks and uncertainties. Forward-looking statements generally can be identified by the use of forward-looking terminology such as “anticipates,” “believes,” “contemplates,” “continues,” “could,” “estimates,” “expects,” “intends,” “may,” “plans,” “predicts,” “pro forma,” “potential” “seeks,” “should,” “target,” or other variations thereof (including their use in the negative), or by discussions of strategies, plans or intentions. All statements, other than statements of historical fact, included in this report regarding our strategy, future operations, future financial position, future revenues, projected costs, prospects and plans and objectives of management are forward-looking statements.
The outcome of the events described in these forward-looking statements is subject to known and unknown risks, uncertainties and other factors that may cause us, our customers’ or our industry’s actual results, levels of activity, performance or achievements expressed or implied by these forward-looking statements to differ. See "Item 1A. Risk Factors," "Item 7.Management's Discussion and Analysis of Financial Condition and Results of Operations," and "Item 1. Business," as well as other sections in this report that discuss some of the factors that could contribute to these differences.
In addition, such forward-looking statements are necessarily dependent upon assumptions and estimates that may prove to be incorrect. Although we believe that the assumptions and estimates reflected in such forward-looking statements are reasonable, we cannot guarantee that our plans, intentions, or expectations will be achieved. The information contained in this report, including the section discussing risk factors, identify important factors that could cause such differences.
The cautionary statements made in this report are intended to be applicable to all related forward-looking statements wherever they appear in this report. The forward-looking statements made in this Annual Report on Form 10-K relate only to events as of the date on which the statements are made. Except as required by law, we undertake no obligation to update or release any forward-looking statements as a result of new information, future events, or otherwise, and assume no obligation to update the reasons why actual results could differ materially from those anticipated in such forward-looking statements.
This report also contains or may contain market data related to our business and industry and any such market data may include projections that are based on certain assumptions. If these assumptions turn out to be incorrect, actual results may differ from the projections based on these assumptions. As a result, our markets may not grow at the rates projected by this data, or at all. The failure of these markets to grow at these projected rates may have a material adverse effect on our business, results of operations, financial condition, and the market price of our common stock.
ANNUAL REPORT ON FORM 10-K
FOR THE FISCAL YEAR ENDED DECEMBER 31, 2022
TABLE OF CONTENTS
| | | | | | | | |
PART I |
Item 1. | Business. | |
| Item 1A. | Risk Factors. | |
| Item 1B. | Unresolved Staff Comments. | |
| Item 2. | Properties. | |
| Item 3. | Legal Proceedings. | |
| Item 4. | Mine Safety Disclosures. | |
| | |
| PART II |
| | |
| Item 5. | Market for the Registrant’s Common Equity, Related Stockholder Matters and Issuer Purchases of Equity Securities. | |
| Item 6. | [Reserved]. | |
| Item 7. | Management’s Discussion and Analysis of Financial Condition and Results of Operations. | |
| Item 7A. | Quantitative and Qualitative Disclosures About Market Risk. | |
| Item 8. | Financial Statements and Supplementary Data. | |
| Item 9. | Changes in and Disagreements with Accountants on Accounting and Financial Disclosure. | |
| Item 9A. | Controls and Procedures. | |
| Item 9B. | Other Information. | |
| Item 9C. | Disclosure Regarding Foreign Jurisdictions that Prevent Inspections. | |
| | |
| PART III |
| | |
| Item 10. | Directors, Executive Officers and Corporate Governance. | |
| Item 11. | Executive Compensation. | |
| Item 12. | Security Ownership of Certain Beneficial Owners and Management and Related Stockholder Matters. | |
| Item 13. | Certain Relationships and Related Transactions, and Director Independence. | |
| Item 14. | Principal Accounting Fees and Services. | |
| | | |
| PART IV |
| | | |
| Item 15. | Exhibits and Financial Statement Schedules. | |
| Item 16. | Form 10-K Summary. | |
| | |
| SIGNATURES | | |
PART 1
Item 1. Business
The Company
Tecogen Inc. (together with its subsidiaries, “we,” “our,” or “us,” or “Tecogen”) designs, manufactures, markets, and maintains high efficiency, ultra-clean cogeneration products. These include natural gas engine driven combined heat and power (CHP) systems, chillers and heat pumps for multi-family residential, commercial, recreational and industrial use. We are known for products that provide customers with substantial energy savings, resiliency from utility power outages and for significantly reducing a customer’s carbon footprint. Our products are sold with our patented Ultera® emissions technology which nearly eliminates all criteria pollutants such as nitrogen oxide ("NOx") and carbon monoxide ("CO"). We developed Ultera® for other applications including stationary engines and forklifts. See "Our Products - Ultera Low-Emissions Technology" for a more in-depth discussion of our Ultera emissions technology. We were incorporated in the State of Delaware on September 15, 2000.
We have wholly-owned subsidiaries American DG Energy, Inc. ("ADGE") and Tecogen CHP Solutions, Inc., and we own a 51% interest in American DG New York, LLC ("ADGNY"), a joint venture. ADGE and ADGNY distribute, own, and operate clean, on-site energy systems that produce electricity, hot water, heat and cooling. ADGE owns the equipment that it installs at a customer’s facility and sells the energy produced by its systems to the customer on a long-term contractual basis.
Our operations are comprised of three business segments:
•our Products segment, which designs, manufactures and sells industrial and commercial cogeneration systems;
•our Services segment, which provides operations and maintenance ("O&M") services and turn-key installation for our products under long term service contracts, and
•our Energy Production segment, which sells energy in the form of electricity, heat, hot water and cooling to our customers under long-term energy sales agreements.
Recent Developments
Assumption of Aegis Energy Services Maintenance Agreements
On March 15, 2023, we entered into an Agreement with Aegis Energy Services, LLC (“Aegis”) regarding the assignment and assumption of certain maintenance agreements, the purchase and sale of certain assets, and related matters (the “Agreement”) pursuant to which we agreed to assume Aegis’ rights and obligations arising on or after April 1, 2023 (the anticipated closing date) under Maintenance Agreements for 202 cogeneration systems, and acquire certain vehicles and inventory used in connection with the performance of maintenance services. The Agreement also provides that we will hire certain Aegis employees who will continue to provide maintenance services relating to the cogeneration systems, and that Aegis will provide transitional services relating to the assumed Maintenance Agreements. At the closing, we will acquire certain Aegis vehicles for $170,000, and between the closing and June 30, 2023, we will acquire from Aegis inventory used to provide maintenance services in exchange for a credit of $300,000 to be used for purchases by Aegis of our cogeneration equipment on or before June 30, 2023. Following the closing, for a period of up to seven years, we will pay Aegis a portion of the revenue collected for maintenance services provided pursuant to the assumed Maintenance Agreements. We also have the right to assume Aegis’ remaining Maintenance Agreements for cogeneration systems on the same terms and conditions but effective December 31, 2023 to the extent that Aegis is permitted to assign such agreements to us in accordance with the terms of such agreements.
Tecochill Hybrid-Drive Air-Cooled Chiller Development
During the third quarter of 2021 we began development of the Tecochill Hybrid-Drive Air-Cooled Chiller. We recognized that there were many applications where the customer wanted an easy to install roof top chiller. Using the inverter design from our InVerde e+ cogeneration module, the system can simultaneously take two inputs, one from the grid or a renewable energy source and one from our natural gas engine. This allows a customer to seek the optimum blend of operational cost savings and greenhouse gas benefits while providing added resiliency from two power sources. We introduced the Tecochill Hybrid-Drive Air-Cooled Chiller at the AHR Expo in February 2023 and expect to see incremental revenue in the fourth quarter of 2023. A patent application based on this concept has been filed with the US Patent and Trademark Office.
Controlled Environment Agriculture: NetZero Greens
On July 20, 2022, we announced the establishment of NetZero Greens, a new business unit focused on low carbon Controlled Environment Agriculture ("CEA"). We believe that CEA offers an exciting opportunity to apply our expertise in clean cooling, power generation, and greenhouse gas reduction to address critical issues affecting food and energy security. We
propose to address this challenge by developing a highly efficient energy solution for CEA grown produce using our cogeneration products in conjunction with solar energy generation, energy storage, and other technologies.
CEA facilities enable multiple crop cycles (15 to 20 cycles) in one year compared to one or two crop cycles in conventional farming. In addition, growing produce close to the point of sale reduces food spoilage during transportation. Food crops grown in greenhouses typically have lower yields per square foot than in CEA facilities, and the push to situate facilities close to consumers in cities requires minimizing land area and maximizing yield per square foot. Yields are increased in CEA facilities by supplementing or replacing natural light with grow lights in a climate-controlled environment - which requires significant energy use.
In recent years our cogeneration equipment has been used in numerous cannabis cultivation facilities because our systems significantly reduce operating costs, reduce the facility GHG footprint and offer resiliency to grid outages. Our experience providing clean energy solutions to cannabis cultivation facilities has given us significant insight into requirements relating to energy-intensive indoor agriculture applications that we expect to be transferable to CEA facilities for food production.
Employee Retention Credit
On March 27, 2020, the Coronavirus Aid, Relief, and Economic Security Act (“CARES Act”) was signed into law providing numerous tax provisions and other stimulus measures, including an employee retention credit (“ERC”), which is a refundable tax credit against certain employment taxes. The Taxpayer Certainty and Disaster Tax Relief Act of 2020 and the American Rescue Plan Act of 2021 extended and expanded the availability of the ERC.
We elected to use an alternative quarter, which qualified us for the ERC in the first, second and third quarters of 2021 because our gross receipts decreased by more than 20% from the first, second and third quarters of 2019. As a result of averaging 100 or fewer full-time employees in 2019, all wages paid to employees in the first, second and third quarters of 2021 were eligible for the ERC. Wages used towards PPP loan forgiveness cannot be used as qualified wages for purposes of the ERC.
During the three months ended June 30, 2021, we recorded an ERC benefit for the first and second quarters of 2021 of $713,269 and, in the three months ended September 30, 2021 we recorded an ERC benefit for the third quarter of 2021 of $562,752, respectively, in other income (expense), net in the our condensed consolidated statements of operations. A current receivable in the amount of $713,269 is included in our condensed consolidated balance sheet as of December 31, 2022. On April 14, 2022, we received $564,027 from the Internal Revenue Service representing the ERC claim for the third quarter of 2021 and $1,275 of accrued interest. We received $667,121 from the Internal Revenue Service on January 12, 2023 in payment of the ERC claimed from the first and second quarters of 2021 and $15,775 of accrued interest. We expect to receive the remaining balance of $46,148 in the second quarter of 2023.
COVID-19 Update
During the first quarter of fiscal 2020, a novel strain of coronavirus (“COVID-19”) began spreading rapidly throughout the world, prompting governments and businesses to take unprecedented measures in response. Such measures included restrictions on travel and business operations, temporary closures of businesses, and quarantines and shelter-in-place orders. The COVID-19 pandemic has significantly impacted supply chains, curtailed global economic activity, and caused significant volatility and disruption in global markets. The COVID-19 pandemic and the measures taken by U.S. Federal, state and local governments in response have materially adversely affected and could in the future materially impact our business, results of operations, financial condition and stock price. The impact of the pandemic remains uncertain and will depend on the growth in the number of infections, fatalities, the duration of the pandemic, steps taken to combat the pandemic, and the development and availability of effective treatments. We have made every effort to keep our employees who operate our business safe and minimize unnecessary risk of exposure to the virus.
Impact of the Russian Invasion of Ukraine
Presently, we have no operations or customers in Russia or the Ukraine. The higher energy prices for natural gas as a result of the war may affect the performance of our Energy Production Segment. However, we have also seen higher electricity prices as much of the electricity production in the United States is generated from fossil fuels. If the electricity prices continue to rise, the economic savings generated by our products are likely to increase. In addition to the direct result of changes in natural gas and electricity prices, the war in Ukraine may result in higher cybersecurity risks, increased or ongoing supply chain challenges, and volatility related to the trading prices of commodities.
Overview of Our Business
Products
Our products offer customers energy savings, resiliency and a cleaner environmental footprint. Our cogeneration, chiller and heat pump systems use an engine to generate electricity or shaft work and recover the waste heat from the engine.
Our systems are greater than 88% efficient compared to typical electrical grid efficiencies of 40% to 50%. As a result, our greenhouse gas (GHG) emissions are typically half that of the electrical grid. Our systems generate electricity and hot water or in the case of our Tecochill product, both chilled water and hot water. Our products are expected to run on Renewable Natural Gas (RNG) as it is introduced into the US gas pipeline infrastructure.
Our natural gas-powered cogeneration systems (also known as combined heat and power or “CHP”) are efficient because they drive electric generators or compressors, which reduce the amount of electricity purchased from the utility while recovering the engine’s waste heat for water heating, space heating, and/or air conditioning at the customer’s building.
Our commercial product lines include:
•the InVerde e+® and TecoPower® cogeneration units; these systems supply electricity and hot water;
•Tecochill® air-conditioning and refrigeration chillers; these systems produce chilled water and hot water;
•Tecochill® hybrid-drive air-cooled chiller; gas engine-driven chillers that provide air conditioning and hot water;
•Tecofrost® gas engine-driven refrigeration compressors; these systems circulate refrigerant and provide hot water as a byproduct;
•Ilios® high-efficiency water heaters; These provide hot water at a significantly higher efficiency than a conventional boiler (250% vs 75%); and,
•Ultera® emissions control technology.
Traditional customers for our InVerde and Tecopower products have a simultaneous need for electrical power and hot water. These include hospitals, nursing homes, schools, universities, health clubs, spas, hotels and motels, office and multi-unit residential buildings. Conversely our Tecochill product benefits customers who have a simultaneous need for cooling and hot water which is typical in sites such as hospitals, ice rinks, indoor agriculture and food processing. Our Tecofrost refrigeration compressors are applied primarily to industrial applications that include cold storage, wineries, dairies, ice rinks and food processing. Market drivers include the price of natural gas, local electricity rates, environmental regulations, and governmental energy policies, as well as customers’ desire to become more environmentally responsible.
Our cooling and refrigeration products provide both cooling and high grade waste heat. This is of particular advantage in facilities that control both temperature and humidity. In such facilities, climate control is achieved by cooling the facility to remove humidity and then reheating to the required temperature. Using engine waste heat to perform the reheat while utilizing natural gas to generate the cooling provides significant economic and environmental benefits. As a result our product has significant competitive advantages in applications that operate year round such as controlled environment agriculture, indoor ice rinks, and hospitals.
Through our factory service centers in California, Connecticut, Florida, Massachusetts, Michigan, New Jersey, New York, and Toronto, Canada, our specialized technical staff maintains our products via long-term service contracts. To date we have shipped over 3,150 units, some of which have been operating for almost 35 years. We established a service center in Toronto, Canada in August 2020 to support our existing population of chillers and cogeneration units including 26 cogeneration units sold in this territory during 2020 to serve public housing facilities.
In 2009, in response to the changing regulatory requirements for stationary engines, our research team developed an economically feasible process for removing air pollutants from engine exhaust. This technology's U.S. and foreign patents were granted beginning in October 2013 and other domestic and foreign patents granted or applications are pending. Branded Ultera®, the ultra-clean emissions technology repositions our engine driven products in the marketplace, making them comparable environmentally with other technologies such as fuel cells, but at a much lower cost and greater efficiency. In 2018, a group of natural gas engine-generators fitted with the Ultera system were successfully permitted in the Los Angeles region for unrestricted operation, the first natural gas engines to do so without operating time limits or other exemption. These engines were permitted to levels matching the California Air Resources Board ("CARB") stringent 2007 emissions requirements, the same emissions standard used to certify fuel cells, and the same emissions levels as a state-of-the-art central power plant. We now offer our Ultera emissions control technology as an option on all our products or as a stand-alone application for retrofitting other rich-burn spark-ignited reciprocating internal combustion engines such as the engine-generators described above.
Our products are designed as compact modular units that are intended to be installed in multiples. This approach has significant advantages over utilizing a single larger cogeneration or chiller unit, allowing placement in constrained urban
settings and redundancy to mitigate service outages. Redundancy is particularly relevant in regions where the electric utility has formulated tariff structures that include high “peak demand” charges. Such tariffs are common in many areas of the country, and are applied by such utilities as Southern California Edison, Pacific Gas and Electric, Consolidated Edison of New York, and National Grid of Massachusetts. Because these tariffs are assessed based on customers’ peak monthly demand charge over a very short interval, typically only 15 minutes, a brief service outage for a system comprised of a single unit can create a high demand charge, and therefore be highly detrimental to the monthly savings of the system. For multiple unit sites, the likelihood of a full system outage that would result in a high demand charge is dramatically reduced, consequently, these customers have a greater probability of capturing peak demand savings.
Our products are sold directly to customers by our in-house marketing team, and by established independent sales agents and representatives.
Our operations are comprised of three business segments. Our Products segment designs, manufactures and sells industrial and commercial cogeneration systems as described above. Our Services segment provides O&M services for our products under long term service contracts. Our Energy Production segment sells energy in the form of electricity, heat, hot water and cooling to our customers under long-term sales agreements.
Ultera Low-Emissions Technology
All of our CHP products are available with the patented Ultera® low-emissions technology as an equipment option. This breakthrough technology was developed in 2009 and 2010 as part of a research effort partially funded by the California Energy Commission and Southern California Gas Company.
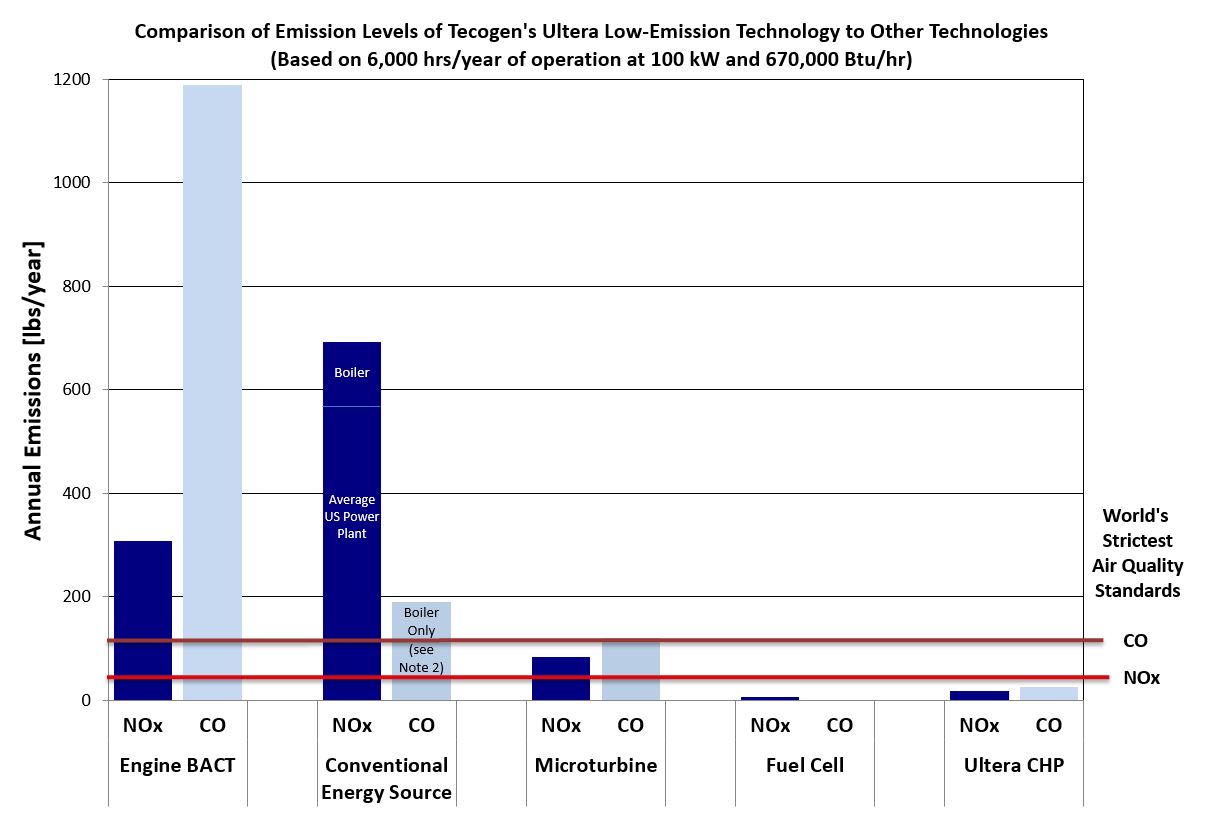
The chart below compares emission levels of our Ultera technology to other technologies. As of December 31, 2022, our Ultera CHP and fuel cell technologies are the only technologies that we know of which comply with California's air quality standards for CO and NOx, represented in the chart by the colored horizontal lines, shown as the world's strictest air quality standards on the lower right of the chart. We believe that as environmental regulation becomes more stringent in the United States, our emissions technology may be used in markets including generators, fork trucks and biogas engines.
(5) (2) (4) (4) (3) (1)
(1) California has the strictest air quality standards for engines in the world
(2) Conventional Energy Source is U.S. power plant and gas boiler. Average U.S. power plant NOx emission rate of 0.9461 lb/MWh from (USEPA eGrid 2012),
CO data not available. Gas boiler efficiency of 78% (www.eia.gov) with emissions of 20 ppm NOx @ 3% O2 (California Regulation SCAQMD Rule 1146.2
and <50 ppmv CO @ 3% O2 (California Regulation SCAQMD BACT).
(3) Tecogen emissions based upon actual third party source test data.
(4) Microturbine and Fuel Cell emissions from EPA CHP Partnership - Catalog of CHP Technologies- March 2015.
(5) Stationary Engine BACT as defined by SCAQMD.
After successfully developing the Ultera technology for our own equipment, our research and development team began exploring other possible emissions control applications in an effort to expand the market for the ultra-clean emissions system. Retrofit kits were developed in 2014 for other stationary engines and in 2015 the Ultera Retrofit Kit was applied successfully to natural gas stand-by generators from other manufacturers, including Generac and Caterpillar.
Historically, standby generators have not been subjected to the strict air quality emissions standards of traditional power generation. However, generators which run for more than 200 hours per year or run for non-emergency purposes (other than routine scheduled maintenance) in some territories are subject to compliance with the same stringent regulations applied to a typical electric utility. As demand response programs become more economically attractive and air quality regulations continue to become more stringent, there could be increased demand for retrofitting standby generators with our Ultera® emissions control technology, thus providing a cost-effective solution to keeping the installed base of standby generators operational and in compliance with regulatory requirements.
In 2017, a group of generators owned by a single customer in Southern California were supplied Ultera kits because of their particular requirement to exceed the 200-hour annual limit. These units are now operational and have been tested by the customer and shown to be compliant with the local pollution limits which we believe to be the strictest anywhere in the United States, and potentially the world. Our CHP products have been permitted to this same standard. However, CHP products are given a heat credit which effectively increases the allowable limit. In 2018, permitting was completed making these certification levels the lowest we have achieved. We believe no other engines have been certified to these levels since the current regulations in the Los Angeles region became effective.
It is noteworthy that these engine-generators have been used in California to power dispersed loads in a fire-prone area where frequent de-energizing of the electric overhead power lines is required for safety. We believe this application to be a new and significant application for the Ultera technology in light of the widely publicized widespread outages in California which have occurred over the recent years.
Services
We provide long-term maintenance contracts, parts sales, and turnkey installation for our products through a network of eleven well-established field service centers in California, the Midwest, the Northeast, the Southeast and in Ontario, Canada. These centers are staffed by our full-time technicians, working from local leased facilities. The facilities provide office and warehouse space for inventory. We encourage our customers to provide internet connections to our units so that we may maintain remote monitoring and communications with the installed equipment. For connected installations, the machines are contacted daily to download their status and provide regular operational reports (daily, monthly, and quarterly) to our service managers. This communications link is used to support the diagnostic efforts of our service staff, and to send messages to pre-programmed phones if a unit has experienced an unscheduled shutdown. In many cases, communications received by service technicians from connected devices allow for proactive maintenance, minimizing equipment downtime and improving operating efficiency for the customer.
The work of our service managers, supervisors, and technicians focuses on our products. Because we manufacture our own equipment, our service technicians bring hands-on experience and competence to their jobs. They are trained at our corporate headquarters and primary manufacturing facility in Waltham, Massachusetts.
Most of our service revenue is in the form of annual service contracts, which are typically of an all-inclusive “bumper-to-bumper” type, with billing amounts proportional to the equipment's achieved operating hours for the period. Customers are thus invoiced in level, predictable amounts without unforeseen add-ons for such items as unscheduled repairs or engine replacements. We strive to maintain these contracts for many years, and work to maintain the integrity and performance of our equipment.
Our products have a long history of reliable operation. Since 1995, we have had a remote monitoring system in place that connects to hundreds of units daily and reports their “availability,” which is the amount of time a unit is running or is ready to run. More than 80% of the units operate above 90% availability, with the average being 93.8%. Our factory service
agreements have directly impacted these positive results and represent an important long-term annuity-like stream of revenue for us.
New equipment sold beginning in 2016 and select upgrades to the existing installed equipment fleet include industrial internet solution which enables us to collect, analyze, and manage valuable asset data continuously and in real-time. This provides the service team with improved insight into the functionality of our installed CHP fleet. Specifically, it enables the service department to perform remote monitoring and diagnostics and to view system results in real time via a computer, smart phone or tablet. Consequently, we can better utilize monitoring data ensuring customers are capturing maximum possible savings and efficiencies from their cogeneration equipment.
Energy Production
Our Energy Production segment sells energy in the form of electricity, heat, hot water and cooling to our customers under long-term sales agreements which represented 7.1% and 7.1% our consolidated revenues for the years ended December 31, 2022 and 2021, respectively. See Note 17 "Segments" of the Notes to the Consolidated Financial Statements.
Sales & Distribution
Our products are sold directly to end-users by our sales team and by established independent sales agents and representatives. We have agreements with manufacturers' representatives and outside sales representatives who are compensated by commissions for designated territories and product lines. During the year ended December 31, 2022 one customer accounted for more than 10% of our revenues. During the year ended December 31, 2021 no customer accounted for more than 10% of our revenues. We typically sell our chiller products through our manufacturing representatives with assistance from our internal sales team. Our combined heat and power products are typically sold direct to end customers by our internal sales team.
Markets and Customers
Worldwide, stationary power generation applications vary from huge central stationary generating facilities (traditional electric utility providers) to back-up generators as small as 2 kW. Historically, power generation in most developed countries such as the United States has been part of a regulated central utility system utilizing high-temperature steam turbines powered by fossil-fuels. This turbine technology, though steadily refined over the years, reached a maximum efficiency (where efficiency means electrical energy output per unit of fuel energy input) of approximately 40% to 50%.
A number of developments related primarily to the deregulation of the utility industry as well as significant technological advances have now broadened the range of power supply choices available to all types of customers. Cogeneration, which harnesses waste energy from power generation processes and puts it to work for other uses on-site, can boost the energy conversion efficiency to nearly 90%, a better than two-fold improvement over the average efficiency of a fossil fuel plant. This distributed generation, or power generated on-site at the point of consumption rather than power generated centrally, eliminates the cost, complexity, and inefficiency associated with electric transmission and distribution. The implications of the CHP distributed generation approach are significant. We believe that if cogeneration were applied on a large scale, global fuel usage might be dramatically curtailed and the utility grid made far more resilient. Furthermore, with technology we have introduced, like the Ultera low-emissions technology, our products can now contribute to better air quality at the local level while complying with the strictest air quality regulations in the United States.
Our products can often reduce the customer’s operating costs (for the portion of the facility loads to which they are applied) by approximately 30% to 60% based on our estimates, which provides an excellent rate of return on the equipment’s capital cost in many areas of the country with high electricity rates. Our chillers are especially suited to regions where utilities impose extra charges during times of peak usage, commonly called “demand” charges. In these cases, the gas-fueled chiller reduces the use of electricity during the summer, the costliest time of year.
Decentralizing power generation or reducing energy requirements at a customer's site not only relieves the capacity burden on existing power plants, but also lessens the burden on transmission and distribution lines. This ultimately improves the grid’s reliability and reduces the need for costly upgrades.
Increasingly favorable economic conditions may improve our business prospects domestically and abroad. Specifically, we believe that natural gas prices are expected to increase from their current values, and that electric rates are expected to continue to rise more significantly over the long-term as utilities pay for grid expansion, better emission controls, efficiency improvements, and the integration of renewable power sources.
Most potential new customers in the U.S. require less than 1 MW of electric power and less than 1,200 tons of cooling capacity. We are targeting customers in states with high electricity rates in the commercial sector, such as California, Connecticut, Massachusetts, New Hampshire, New Jersey, and New York. Most of these states also have high peak demand rates, which favor utilization of our modular units in groups so as to assure redundancy and peak demand savings.
Governmental agencies in some of these regions may also provide generous rebates that can improve the economic viability of our systems.
The Inflation Reduction Act of 2022 increased Federal tax credits, including the investment tax credit (ITC), to up to thirty percent (30%) of the project cost for projects incorporating certain low emission technologies, including CHP equipment, that begin construction before January 1, 2025 and provides for an additional ten percent (10%) credit if the taxpayer satisfies additional requirements relating to domestic content. State and local governments and tax-exempt entities may also benefit from certain tax credits through direct payments or transfers of tax credits to unrelated third parties. This particular new direct pay option is especially impactful given the fact that many ideal facilities for CHP systems are not-for-profit, including many healthcare and hospital facilities, schools and universities, as well as recreation centers. These customers historically have not been able to benefit from previous iterations of the ITC. Under the federal definition for CHP systems, all of our products, including our air-conditioning and cooling models (Tecochill and Tecofrost) qualify for the tax credit when heat recovery is incorporated into the system design.
We aggressively market to potential customers where utility pricing aligns with our advantages. These areas include regions that have strict emissions regulations, such as California, or those that reward CHP systems that are especially non-polluting, such as New Jersey. Currently, more than 23 states recognize CHP as part of their Renewable Portfolio Standards or Energy Efficiency Resource Standards.
The traditional markets for CHP systems are buildings with long hours of operation and with corresponding demand for electricity or cooling and heat. Traditional customers for our cogeneration systems include controlled environment agriculture, hospitals, nursing homes, colleges, universities, health clubs, spas, hotels, motels, office and retail buildings, food and beverage processors, multi-unit residential buildings, laundries, ice rinks, swimming pools, factories, municipal buildings, and military installations.
Traditional customers for our chillers, refrigeration compressors and heat pumps overlap with those for our cogeneration systems. Engine-driven chillers are often used as replacements for aging electric chillers because they both occupy similar amounts of floor space and require similar maintenance schedules. This is also the case with refrigeration compressors.
Competition
The markets for our products are highly competitive, though we believe that we offer customers a suite of premier best-in-class clean energy and thermal solutions.
InVerde and Tecopower
Our combined heat and power products that produce electricity and hot water compete with the utility grid, existing technologies such as other reciprocating engine and microturbine CHP systems, and other emerging distributed generation technologies including solar power, wind-powered systems, and fuel cells. Our products are highly competitive between 60KW and 1.5MW in electrical generation capacity. In this size range we have other reciprocating engine competitors, although we have strong competitive advantages when it comes to ease of utility interconnection, ease of install in tight spaces and our microgrid capabilities. We believe that Capstone Turbine Corporation is the only microturbine manufacturer with a commercial presence in CHP.
Although operating solar and wind powered systems produce no emissions, the main drawbacks to these renewable powered systems are their dependence on weather conditions, their reliance on backup utility grid-provided power, and high capital costs that can often make these systems uneconomical without government subsidies. Similarly, while the market for fuel cells is still developing, a number of fuel cell companies are focused on markets similar to ours. Fuel cells, like solar and wind powered systems, have received higher levels of incentives for the same type of applications as CHP systems in many territories. We believe that, notwithstanding these higher government incentives, our CHP solutions provide a better value and more robust solution to end users in most applications.
Additionally, our patents relating to the Ultera ultra-low emissions technology give our products a strong competitive advantage in markets where severe emissions limits are imposed or where very clean power is favored, such as New Jersey, California, and Massachusetts.
Overall, we compete with end users’ other options for electrical power, heating, and cooling on the basis of our technology’s ability to:
•Provide a more efficient solution that provides operational savings for a facility's energy needs including cooling, electricity and hot water;
•Provide power when a utility grid is not available or goes out of service;
•Reduce emissions of criteria pollutants (NOx and CO) to near-zero levels and cut the emission of greenhouse gases such as carbon dioxide due to increased efficiencies compared to the electric grid;
•Provide reliable on-site power generation, heating and cooling services.
We believe that no other company has developed a product that provides the features and benefits provided by our inverter-based InVerde e+, which offers UL-certified grid connection and sophisticated off-grid and microgrid capabilities. An inverter-based product with at least some of these features has been introduced by others, but we believe that they face serious challenges in duplicating all the unique features of the InVerde e+. Competitors' product development time and costs could be significant. We have exclusive license rights to Microgrid algorithms developed by the University of Wisconsin researchers. We have exclusive rights for engine-driven systems utilizing natural gas or diesel fuel in the application of power generation where the per-unit output is less than 500kW. The software allows our products to be integrated as a Microgrid, where multiple InVerde e+® units can be seamlessly isolated from the main utility grid in the event of an outage and re-connected to it afterward. We expect that our patents and license for Microgrid software will deter others from offering certain important functions. See "Business-Intellectual Property."
Similarly, in the growing Microgrid segment, neither fuel cells nor microturbines can respond to changing energy loads when the system is disconnected from the utility grid. Engines such as those used in our equipment inherently have a fast-dynamic response to step load changes, which is why they are the primary choice for emergency generators. Fuel cells and microturbines require additional energy storage systems to be utilized for time-limited off-grid operation, giving our engine-driven solutions an advantage for Microgrid and resiliency applications.
Tecochill Chillers
Our Tecochill line of chillers are the only gas-engine-driven chillers available on the market. Natural gas can also fuel absorption chillers, which use fluids to transfer heat without an engine drive. However, engine driven chillers continue to have an efficiency advantage over absorption machines. Tecochill chillers reach efficiencies well above levels achieved by similarly sized absorption systems. Low natural gas prices in the United States improve the economics of natural gas-fueled chillers while their minimal electric demand on backup power systems make them ideal for facilities requiring critical precision climate control. In 2023 we plan to expand our Tecochill range of products to include a hybrid air cooled chiller based on the inverter design used in the InVerde. The hybrid-drive air-cooled chiller will take simultaneous inputs from the electrical grid and the natural gas engine so that it can operate with the lowest cost and/or greenhouse gas footprint at any time based on changing conditions.
Ilios Heat Pump
The Ilios® water heater and other heat pump products compete in both the high-efficiency water heating market and the CHP market. A few companies manufacture gas-engine heat pumps, including Yanmar and Tedom that we believe are competitive with our products.
Research & Development
Our long and rich research and development tradition and sustained programs have allowed us to cultivate deep engineering expertise. We have strong core technical knowledge that is critical to product support and continuous product improvement efforts. Our TecoDrive engine, permanent magnet generator, cogeneration and chiller products, InVerde, Ilios heat pumps, Ultera emissions control system, and our hybrid-drive air-cooled chiller were all created and optimized in-house with support from third-parties.
We continue to seek alliances with utilities, government agencies, universities, research facilities, and manufacturers. We have succeeded in developing new technologies and products in collaboration with several entities, including:
•Sacramento Municipal Utility District has provided test sites to us since 2010.
•Southern California Gas Company and San Diego Gas & Electric Company, each a Sempra Energy subsidiary, have granted us research and development contracts since 2004.
•Department of Energy’s Lawrence Berkeley National Laboratory, with whom we have had research and development contracts since 2005, including ongoing Microgrid development work related to the InVerde.
•Eastern Municipal Water District in Southern California has co-sponsored demonstration projects to retrofit both a natural-gas powered municipal water pump engine and a biofuel powered pumping station engine with the Ultera low emissions technology since 2012.
•Consortium for Electric Reliability Technology Solutions executed research and development contracts with us, and has provided a test site to us since 2005.
•California Energy Commission with whom we had a research and development contract from 2004 until March 2013.
•The AVL California Technology Center performed a support role in research and development contracts as well as internal research and development on our Ultera emission control system from August 2009 to November 2011. In addition, the Center supported our research on emissions from gasoline vehicles from January of 2016 through October 2017. AVL researchers collaborated with our engineers on several peer reviewed papers published by technology association SAE International in 2017 and 2018.
Certain components of our InVerde product were developed through a grant from the California Energy Commission. This grant includes a requirement that we pay royalties on all sales of all products related to the grant, which obligation expired in 2022. As of December 31, 2022, royalties accrued in accordance with this grant agreement were less than $10,000 on an annual basis.
We also continue to leverage our resources with government and industry funding, which has yielded a number of successful developments, including the Ultera low-emissions technology, sponsored by the California Energy Commission and Southern California Gas Company. Pursuant to the terms of the grants from the California Energy Commission, the California Energy Commission has a royalty-free, perpetual, non-exclusive license to these technologies for government purposes.
Our current internal R&D efforts are focused on the hybrid-drive air-cooled chiller that utilizes the basic inverter design used in the InVerde e+. Management believes that this chiller will address a significant market segment that is currently not addressed by our existing Tecochill product. For the years ended December 31, 2022 and 2021, we spent $732,873 and $542,079, respectively, on research and development activities.
Intellectual Property
Currently, we hold twelve United States patents for our technologies:
•10,774,720: “NOx Reduction Using a Dual-Stage Catalyst System with Intercooling in Vehicle Gasoline Engines under Real Driving Condition.” This patent, granted in September 2020, improves the removal of Non-Methane Organic Gases (NMOG) and Carbon Monoxide (CO) from vehicle emissions. The improved performance, consisting of up to 90% reductions in NMOG and CO results from increased oxidation of NMOG and CO due to a lower temperature environment in the second stage catalyst.
•10,774,724: “Dual Stage Internal Combustion Engine Aftertreatment System Using Exhaust Gas Intercooling and Charger Driven Air Ejector.” This patent, granted in September 2020, relates to the use of turbo compressors and exhaust gas intercoolers in turbocharged engines to reduce the complexity and cost of Ultera emissions reduction systems.
•9,995,195: “Emissions control systems and methods for vehicles.” This patent, granted in June 2018, is a method for vehicle cold start to enhance the removal of CO and hydrocarbons emissions, which are extremely problematic for cold engines. Air is injected in the exhaust between the engine’s close-coupled catalyst and underbody catalyst. Once the engine is warmed (> 500 F exhaust) this air stream is shut off. This method synergizes well with the Ultera system by utilizing the injection air feed for an alternative purpose during engine start.
•9,956,526: “Poison-Resistant Catalyst and Systems Containing Same.” This patent, granted in May 2018, relates to a special catalyst formulation that is resistant to contaminant induced corrosion in conditions like those of the Ultera second stage. These poisons or contaminants are most commonly sulfur compounds.
•9,702,306: “Internal Combustion Engine Controller.” This patent granted in July of 2017 relates to the unique control methodology used in the InVerde e+ CHP unit that maximizes engine fuel economy under variable speed operation.
•9,470,126: "Assembly and method for reducing ammonia in exhaust of internal combustion engines." This patent, granted in October 2016, is related to the Ultera emission control system applicable to all our products.
•9,856,767: “Systems and methods for reducing emissions in exhaust of vehicles and producing electricity." This patent, filed in November 2015 and published in March 2016, relates to the development of the Ultera emission control system for vehicle applications.
•9,121,326: “Assembly and method for reducing nitrogen oxides, carbon monoxide and hydrocarbons in exhausts of internal combustion engines.” This patent, granted in September 2015, is related to the Ultera emission control system applicable to all our products.
•9,651,534: "Assembly and Method for reducing nitrogen oxides, carbon monoxide, hydrocarbons and hydrocarbon gas in exhausts of internal combustion engines and producing and electrical output." This patent granted in April 2017, is related to the Ultera emission control system applicable to all our products.
•8,578,704: “Assembly and method for reducing nitrogen oxides, carbon monoxide, and hydrocarbons in exhausts of internal combustion engines.” This patent, granted in November 2013, is for the Ultera emission control system applicable to all our products.
•7,243,017: “Method for controlling internal combustion engine emissions.” This patent, granted in July 2007, applies to the specific algorithms used in our engine controller for metering fuel usage to obtain the correct combustion mixture and is technology used by most of our engines.
•7,239,034: “Engine driven power inverter system with cogeneration.” This patent, granted in July 2007, pertains to the utilization of an engine-driven CHP module combined with an inverter and applies to our InVerde product specifically.
Our patents expire between 2024 and 2037.
In addition, we have licensed specific rights to Microgrid software algorithms developed by University of Wisconsin researchers for which we pay royalties to the assignee, The Wisconsin Alumni Research Foundation (WARF). Pursuant to U.S. Patent 7,116,010, titled “Control of small distributed energy resources”, granted in 2006 and expires on March 27, 2024. Our exclusive rights are for engine-driven systems utilizing natural gas or diesel fuel in the application of power generation where the per-unit output is less than 500 kW. The software allows our products to be integrated as a Microgrid, where multiple InVerde units can be seamlessly isolated from the main utility grid in the event of an outage and re-connected to it afterward. The licensed software allows us to implement such a Microgrid with minimal control devices and associated complexity and cost. We consider the Microgrid software algorithm licensed from WARF to be a key feature of our InVerde product, and one that would be difficult to duplicate outside the patent. We pay WARF a royalty for each cogeneration module sold using the licensed technology. Such royalty payments have been in the range of $5,000 to $15,000 on an annual basis through the year ended December 31, 2022. In addition, WARF reserved the right to grant non-profit research institutions and governmental agencies non-exclusive licenses to practice and use, for non-commercial research purposes, the technology developed by us that is based on the licensed software.
We consider our patents and licensed intellectual property to be important in the operation of our business. The expiration, termination, or invalidity of one or more of these patents may have a material adverse effect on our business.
One other company has developed a product that seeks to compete with our inverter-based InVerde, although it does not offer all of the same benefits and features offered by our InVerde products. We anticipate that an inverter-based product with at least some of the features offered by our InVerde products will be introduced by others, but we believe that our competitors will face serious challenges in duplicating the InVerde. Product development time and costs would likely be significant, and we expect that our patent for the inverter-based CHP system (7,239,034) provides significant protections for key features.
In 2013, we purchased rights to designs and technology, including patents granted or pending for our permanent magnet generators. A key component of our InVerde module uses this acquired technology.
Our patents for the Ultera low-emissions control technology applies to all our gas engine-driven products and may have applications to other rich-burn spark-ignited internal combustion engines. We have been granted patents for this technology in Europe, Australia, Brazil, Canada, Japan, Mexico, Korea and Singapore.
Copyrights
Our control software is protected by copyright laws or through an exclusive license agreement.
Trademarks
We have registered the brand names of our equipment and logos used on our equipment. These registered and pending trademarks include Tecogen, Tecochill, Tecopower, Ultera, InVerde, Ilios, InVerde e+, NetZeroGreens and the associated logos. We will continue to trademark our product names and symbols.
We rely on treatment of our technology as trade secrets through confidentiality agreements, which our employees and vendors are required to sign. Also, we rely on non-disclosure agreements with others that have or may have access to confidential information to protect our trade secrets and proprietary knowledge.
Sourcing & Manufacturing
We are focused on continuously strengthening our manufacturing processes and increasing operational efficiencies. Many of the components used in the manufacture of our highly-efficient clean energy equipment are readily fabricated from commonly available raw materials or are standard available parts sourced from multiple suppliers. We believe that adequate supplies exist to meet our near to medium term manufacturing needs. We have an on-going focus on developing and implementing new systems to simplify our manufacturing processes, product sourcing methods, and our supply chain.
We have a combined total of approximately 27,000 square feet of manufacturing and warehouse space running on a single 5-day per week shift at our Waltham, Massachusetts facility. We believe we have sufficient spare capacity to meet near to medium term demand without incurring additional fixed costs. Although our Waltham lease expires March 31, 2024, we have identified an alternate space and are currently negotiating the lease terms.
Government & Regulation
Several kinds of federal, state and local government regulations affect our products and services, including but not exclusive to:
•product safety certifications and interconnection requirements;
•air pollution regulations which govern the emissions allowed in engine exhaust;
•state and federal incentives for CHP technology;
•various local building and permitting codes and third-party certifications;
•electric utility pricing and related regulations; and
•federal and state laws regarding the legalization of cannabis for medicinal and recreational use.
Our markets can be positively or negatively impacted by the effects of governmental and regulatory matters. We are impacted not only by energy policy, laws, regulations and incentives of governments in the markets in which we sell, but also by rules, regulations and costs imposed by utilities. Utility companies or governmental entities may place barriers on the installation or interconnection of our products with the electric grid. Further, utility companies may charge additional fees to customers who install on-site power generation to reduce the electricity they take from the utility and to preserve electric capacity available from the grid for back-up or standby purposes. These types of restrictions, fees or charges could hamper the ability to install or effectively use our product or increase the cost to our potential customers for using our systems. This could make our systems less desirable, adversely impacting our revenue and profitability. In addition, utility rate reductions can make our products less competitive, causing a material adverse effect on our operations. These costs, incentives and rules are not always the same as those faced by technologies with which we compete.
Similarly, rules, regulations, laws and incentives could also provide an advantage to our distributed generation solutions as compared with competing technologies because they enable compliance in a lower cost, more efficient manner with reduced emissions and higher fuel efficiency which helps our customers combat the effects of global warming. We may benefit from increased government regulations that impose tighter emission and fuel efficiency standards. We encourage investors and potential investors to carefully consider the risks described under "Item 1A. Risk Factors" below regarding various aspects of the regulatory environment and other related risks.
Our products are well-suited to meet the needs of the rapidly emerging indoor agriculture market, including cannabis and other high volume leafy greens. To date our focus in the indoor agricultural market has primarily involved cannabis, a product with high revenue generating potential. However, we have sold to other indoor agricultural growers, and we believe that the indoor food production market will provide significant opportunities for us. The indoor agriculture market in particular has the potential to be a major driver of growth as states move to legalize the use of cannabis for medicinal purposes and recreational use. However, under the Controlled Substances Act (CSA) cannabis continues to be categorized as a Schedule I drug, so that cannabis growers continue to face significant uncertainty regarding their ability to conduct business.
First passed by Congress in 2014, the Rohrabcher-Farr Amendment is an amendment to the annual appropriations bill that, among other things, funds the Department of Justice. It prohibits the US Attorney General from using funds to prosecute the medical use of cannabis. It does not address recreational use. On January 4, 2018, US Attorney General Jeff Sessions rescinded the Cole memo. Written in 2013, the Cole memo had directed US Attorneys not to allocate resources to prosecute "individuals whose actions are in clear and unambiguous compliance with existing state laws" regarding the cannabis market.
As of the date of the filing of this report, we are not aware of any US Attorney who has taken action against participants in the recreational cannabis market operating in accordance with state law. The uncertainty we face regarding the potential for growth from the sales to the cannabis industry is due in part to uncertainty regarding prosecutorial priorities of the current Presidential administration as well as the ability of cannabis growers to obtain funding in an environment where national bankers are not permitted to fund cannabis growth facilities.
Our Energy Production segment is subject to extensive government regulation. We are required to file for local construction permits (electrical, mechanical and the like) and utility interconnects, and are required to make various local and state filings related to environmental emissions.
In the past, many electric utility companies have raised opposition to distributed generation of energy, a critical element of our business model. Such resistance has generally taken the form of stringent standards for interconnection and the use of target rate structures as disincentives to combined generation of on-site power and heating or cooling services. A distributed generation facility's ability to obtain reliable and affordable back-up power through interconnection with the grid is essential to our business model. Utility policies and regulations in most states often do not accommodate widespread on-site generation. Barriers erected by electric utility companies and unfavorable regulations, where applicable, make our ability to connect to the electric grid at customer sites more difficult or uneconomic and is an impediment to the growth of our business. The development of our business could be adversely affected by any slowdown or reversal in the utility deregulation process or by difficulties in negotiating back-up power supply agreements with electric providers in the areas where we seek to do business.
Environmental Matters
We are regulated by federal, state and international environmental laws governing our use, transport and disposal of substances and control of emissions. In addition to governing our manufacturing and service operations, these laws often impact the development of our products, including, but not limited to, required compliance with air emissions standards applicable to internal combustion engines. We have made, and will continue to make, the necessary research and development and capital expenditures to comply with these emissions standards.
Human Capital Resources
We believe our success in delivering energy efficient, ultra clean cogeneration systems, chillers and energy production services relies on our culture, values, and the creativity and commitment of our people. We strive to maintain healthy, safe, and secure working conditions and a workplace where our employees are treated with respect and dignity. Our vision is to create an inclusive, diverse and authentic community that inspires collaboration, integrity, engagement, and innovation. We are striving to create a world-class employee experience – one that offers opportunity for personal and professional growth, and enables work-life balance that aligns with our core values.
Employee Health and Safety
Employee health and safety continues to be a priority in every aspect of our business. We have taken a common-sense approach to safety that helps us understand and reduce hazards in our business. Training, risk assessment, safety coaching, and employee engagement are all programs that help us consistently manage our facility and employee safety. As resources are available, we expect to continue to expand and evolve our safety programs to better meet our employee needs and workplace conditions as our business grows. Fiscal year 2022 was unique due to the impact that the COVID-19 pandemic had on organizations, including ours. Our response has consistently evolved to meet the turbulent environment. Our efforts included:
• The senior management team implemented regular communication regarding impacts of the
COVID-19 pandemic, including health and safety protocols and procedures.
• Implementing a hierarchy of controls to address hand washing, social distancing, cleaning areas and frequency, personal protective equipment and resources to stay up to date on the changing conditions.
• Deployment of face covers across the company for use in areas where they are required and recommended.
• Limiting domestic and international non-essential travel for all employees.
• Providing additional days of leave for full- and part-time employees to cope with the illness.
• Restricting access to our corporate offices.
• Providing public access by appointment or pickup only in high risk areas.
• Implementing protocols to address actual and suspected COVID-19 cases and potential exposure.
• Working closely with customers to meet their specific COVID-19 requirements and maintain service.
We understand the benefits of employee health and safety and continue to invest in programs, products, and resources. We also understand the environment of trust and fairness that exists when information is openly shared. We also continue to invest in products and services to meet the health and safety needs of our customers and communities.
Talent Acquisition and Development
Our values are integral to our employment process and serve as guideposts for leadership. The ultimate goal is straightforward: find great people, ask them to join, and give them a reason to stay. Reasons include fair compensation, a complete array of employee benefits to include: health, dental and life insurance; short-term and long-term disability insurance; HSA account funding; generous time off benefits; and the grant of options or awards to purchase shares of our common stock. Recently we instituted web-based training for all of our employees.
Employees
As of December 31, 2022, we employed 85 full-time employees and 1 part-time employees, including 6 sales and marketing personnel, 51 service personnel, 19 manufacturing personnel and 10 finance and administrative personnel. Nine of our New Jersey service employees are represented by a collective bargaining agreement which expires on December 31, 2025 and thereafter renews annually unless terminated by either party by written notice within sixty days prior to the expiration date.
Available Information
Our internet website address is http://www.tecogen.com. Our Annual Reports on Form 10-K, Quarterly Reports on Form 10-Q, Current Reports on Form 8-K and other reports and filings with the SEC are available free of charge on our website as soon as reasonably practicable after the reports are filed with, or furnished to, the SEC. Information contained on our website is not incorporated into this Annual Report on Form 10-K or our other securities filings with the SEC. The SEC maintains an internet website at www.sec.gov which contains reports, proxy and information statements, and other information regarding issuers that file electronically with the SEC.
Item 1A. Risk Factors
Our business operations, financial condition, results of operations and stock price may be affected by a number of factors. In additional to the other information in this Form 10-K, the following factors and the information contained under the heading ''Cautionary Note Concerning Forward-Looking Statements'' should be considered in evaluating our company and our business. The risks described below may not be the only risks we face. Additional risks that we do not yet know of, or that we currently think are immaterial, may also impair our business operations or financial results. If any of the events or circumstances described in the following risks occur, our business, financial condition and results of operations could suffer and the trading price of our common stock could decline.
Risks Relating to Our Business Strategy and Industry
Our financial condition and results of operations have been and may be materially adversely affected by the 2019 novel Coronavirus (COVID-19) pandemic.
COVID-19 has had and continues to have a significant impact around the world, prompting governments and businesses to take unprecedented measures in response. Such measures have included restrictions on travel and business operations, temporary business closures, and quarantine and shelter-in-place orders. The COVID-19 pandemic has at times significantly curtailed global economic activity and caused significant volatility and disruption of financial markets.
COVID-19 has and could continue to have a material and adverse effect on our business, financial condition and results of operations. During the course of the pandemic, certain of our suppliers have experienced disruptions, resulting in supply shortages that affected revenues, and similar disruptions could occur in the future. Public safety measures can also adversely impact demand for our products and services in affected areas.
COVID-19 has negatively impacted our revenue and may continue to do so. We may need to raise additional financing if cash generated from our operations is insufficient.
During the year ended December 31, 2022, our revenues continued to be negatively impacted due to supply chain issues and project deferrals. The extent to which the coronavirus will continue to impact our business and our financial results will depend on future developments, which are highly uncertain and cannot be predicted. As part of our pandemic response plan, our sales, engineering, and select administrative functions may be operated remotely when necessary or appropriate while our manufacturing and service teams continues to function normally, subject to customer-initiated disruptions in service.
Due to the impact of the coronavirus pandemic on our customers, including the closure of certain customers' facilities and difficulties that customers may have in maintaining their business and operations during the pandemic, collections from certain existing customers have been and may continue to be deferred or difficult or impossible to collect, that there may be delays in the implementation of current projects and the completion of sales of our products and services.
To the extent cash generated from operations in the future is insufficient to fund our operating requirements, we will be required to seek additional outside financing. Our inability to obtain necessary capital or financing to fund these working capital needs will adversely affect our ability to expand our operations.
If the cash generated by operations together with proceeds of loans under the Coronavirus Aid, Relief, and Economic Security Act ("CARES Act,") that we have obtained and were forgiven as described below are insufficient to fund our future operating requirements, we will need to raise additional funds through public or private equity or debt financings. Such financing may not be available to us when needed, or if available, may not be available on terms that are favorable to us and could result in significant dilution to the holdings of our stockholders. Furthermore, any such debt financing is likely to include financial and other covenants that may impede our ability to react to changes in the economy or industry. If adequate financing is not available when needed, we may be required to implement cost-cutting strategies, delay production, curtail research and development efforts, or implement other measures, which may adversely affect our results of operations and financial conditions and the price of our stock.
On April 17, 2020, we were granted a loan of $1,874,200 under the Paycheck Protection Program established pursuant to the CARES Act to provide relief to certain businesses as a result of the pandemic. The loan was provided to us by Webster Bank, N.A. and was guaranteed by the United States Small Business Administration (“SBA”). We utilized the loan for payroll, rent, and utilities during the applicable covered period. Effective January 11, 2021, the loan together with all accrued interest thereon was forgiven in full by the SBA. The loan forgiveness is considered to be nontaxable for both state and federal purposes and has been treated accordingly in our condensed consolidated financial statements.
On February 5, 2021, we obtained a Second Draw Paycheck Protection Program unsecured loan in the amount of $1,874,269 through Webster Bank, pursuant to the Paycheck Protection Program under the CARES Act and is guaranteed by the SBA. We utilized the loan for payroll, rent, and utilities during the applicable covered period. Effective September 8, 2021, the loan together with all accrued interest thereon was forgiven in full by the SBA. The loan forgiveness is considered to be nontaxable for both state and federal purposes and has been treated accordingly in our condensed consolidated financial statements.
The CARES ACT was signed into law providing numerous tax provisions and other stimulus measures, including an employee retention credit (“ERC”), which is a refundable tax credit against certain employment taxes. The Taxpayer Certainty and Disaster Tax Relief Act of 2020 and the American Rescue Plan Act of 2021 extended and expanded the availability of the ERC.
We qualified for the ERC in the first, second and third quarters of 2021 and recognized $1,276,021 in Employee Retention Credits in 2021. As of January 12, 2023, we have received $1,229,873 in payment of the ERC's and expect to receive the remaining balance of $46,148 in the second quarter of 2023.
Based upon our operating and cash flow plan, we believe existing resources, including cash and cash flows from operations will be sufficient to meet our working capital needs for the next twelve months. If adequate financing is not available when needed, we may be required to implement cost-cutting strategies, delay production, curtail research and development efforts, or implement other measures, which may adversely affect our overall results of operations and financial condition and the price of our stock.
If we experience a period of significant growth or expansion, it could place a substantial strain on our resources.
If our cogeneration and chiller products penetrate the market rapidly, we may be unable to deliver large volumes of technically complex products or components to our customers on a timely basis and at a reasonable cost to us. We have never ramped up our manufacturing capabilities to meet significant large-scale production requirements. If we were to commit to deliver large volumes of products, we may not be able to satisfy these commitments on a timely and cost-effective basis.
Our operating history is characterized by losses and there can be no assurance we will be able to increase our sales and sustain profitability in the future.
We have historically incurred annual operating losses, including an operating loss of $2,447,927 in 2022. Although we made a net profit of $3,696,000 in 2021, as a result of the Paycheck Protection Program Loans and Employee Retention Credits in the amount of $5,049,035 in the aggregate, we have historically incurred annual operating losses. Our business is capital intensive and, because our products generally are built to order with customized configurations, the lead time to build and deliver a unit can be significant. We may be required to purchase key components long before we can deliver a unit and receive payment. Changes in customer orders or lack of demand may also impact our profitability. There can be no assurance we will be able to increase our sales and achieve and sustain profitability in the future.
We are dependent on a limited number of third-party suppliers for the supply of key components for our products.
We use third-party suppliers for components in all of our products. Our engine supplier, generator supplier for cogeneration products (other than the InVerde), and the compressor and vessel sets in our chillers, are all purchased from large
multinational equipment manufacturers. The loss of one or more of our suppliers could materially and adversely affect our business if we are unable to replace them. While alternate suppliers for the manufacture of our engine, generators and compressors have been identified, should the need arise, there can be no assurance that alternate suppliers will be available and able to provide such items on acceptable terms or on a timely basis.
From time to time, shipments of components for our products can be delayed because of industry-wide or other shortages of necessary materials and components from third-party suppliers, as well as shipping delays at points of importation. A supplier's failure to supply components in a timely manner, or to supply components that meet our quality, quantity, or cost requirements, or our inability to obtain substitute sources of these components on a timely basis or on terms acceptable to us, could impair our ability to deliver our products in accordance with contractual obligations.
The amount of our backlog is subject to fluctuation due to our customers’ experiencing unexpected delays in financing, permitting or modifications in specifications of the equipment.
Our total product and installation backlog as of December 31, 2022 was $6,722,138 compared to $11,321,043 as of December 31, 2021. Although we expect our customers to issue definitive purchase orders with respect to such backlog, there can be no assurance that such amounts will not be subject to modification in the event customers experience unexpected delays in obtaining permits, interconnection agreements or financing. As a consequence of COVID-19, we have experienced order delays and deferrals for our products due to business closures or the inability to obtain government issued permits to conduct product installations. Any of such events may result in customers modifying the equipment or the terms or timing of the expected installation, which may result in changes to the amount of backlog attributed to those projects.
We experience significant fluctuations in revenues from quarter to quarter on our product sales which may make period to period comparisons difficult.
We have low volume, high dollar sales for projects that are generally non-recurring, and therefore our sales have fluctuated significantly from period to period. Fluctuations cannot be predicted because they are affected by the purchasing decisions and timing requirements of our customers, which are unpredictable. Such fluctuations may make quarter to quarter and year to year comparisons difficult.
We expect significant competition for our products and services.
Many of our competitors and potential competitors are well established and have substantially greater financial, research and development, technical, manufacturing and marketing resources than we do. If these larger competitors decide to focus on the development of distributed power or cogeneration, they have the manufacturing, marketing and sales capabilities to complete research, development, and commercialization of these products more quickly and effectively than we can. There can also be no assurance that current and future competitors will not develop new or enhanced technologies or more cost-effective systems, and therefore, there can be no assurance that we will be successful in this competitive environment.
We may not achieve production cost reductions necessary to competitively price our products, which would adversely affect our sales.
We believe that we will need to reduce the unit production cost of our products over time to maintain our ability to offer competitively priced products. Our ability to achieve cost reductions will depend on our ability to develop low-cost design enhancements, to obtain necessary tooling and favorable supplier contracts, and to increase sales volumes so we can achieve economies of scale. We can make no assurance that we will be able to achieve any such production cost reductions. Our failure to do so could have a material adverse effect on our business and results of operations.
Our products involve a lengthy sales cycle and we may not anticipate sales levels appropriately, which could impair our results of operations.
The sale of our products typically involves a significant commitment of capital by customers, with the attendant delays frequently associated with large capital expenditures. For these and other reasons, the sales cycle associated with our products is typically lengthy and subject to a number of significant risks over which we have little or no control. We expect to plan our production and inventory levels based on internal forecasts of customer demand, which is highly unpredictable and can fluctuate substantially. If sales in any period fall significantly below anticipated levels, our financial condition, results of operations and cash flow would suffer. If demand in any period increases well above anticipated levels, we may have difficulties in responding, incur greater costs to respond, or be unable to fulfill the demand in sufficient time to retain the order, which would negatively impact our operations. In addition, our operating expenses are based on anticipated sales levels, and a high percentage of our expenses are generally fixed in the short term. As a result of these factors, a small fluctuation in timing of sales can cause operating results to vary materially from period to period.
The economic viability of our projects depends on the price spread between natural gas and other fuel and electricity, and the variability of these prices creates a risk that our projects will not be economically viable and that potential customers will avoid such energy price risks.
The economic viability of our CHP products depends on the spread between natural gas fuel and electricity prices. Volatility in one component of the spread, such as the cost of natural gas and other fuels (e.g., propane or distillate oil), can be managed to some extent by means of futures contracts. However, the regional rates charged for both base load and peak electricity may decline periodically due to excess generating capacity or general economic recessions, and both the cost of natural gas and the cost of electricity for base load and peak load may be adversely affected by geopolitical disruptions such as Russian expansion into the Ukraine and political and other responses to such expansionist activity.
Our products and on-site utility service could become less competitive if electric rates were to fall substantially in the future, although, historically, electric rates have not had any sustained decline in price. Potential customers may perceive the risk of unpredictable swings in natural gas and electricity prices as a risk of investing in on-site CHP, and may decide not to purchase CHP products.
We may make acquisitions or take other corporate strategic actions that could harm our financial performance.
To expedite development of our business, including with regard to equipment installation and service functions, we anticipate investigating and potentially pursuing future acquisitions of complementary businesses. Risks associated with such acquisitions include the diversion of management attention and cash from operations to cover the costs associated with acquisitions, disruption of our existing operations, loss of key personnel in the acquired companies, dilution through the issuance of additional securities, assumptions of existing liabilities, and commitment to further increase operating expenses. If any or all of these problems actually occur, acquisitions could negatively impact our financial performance and future stock value.
Expiring customer contracts may lead to decreases in revenue and increases in expenses.
Each year, a portion of our customer contracts expire and need to be renewed or replaced. We may not be able to renew or extend contracts with existing customers or obtain replacement contracts at attractive rates or for the same term as the expiring contracts. To the extent we are unable to extend customer contracts prior to their expiration dates, energy production revenue will decline due to less energy billing. Expiring customer contracts can also lead to an increase in expenses because we are obligated to remove the equipment from the customer location at our own expense at the end of the customer contract. The investment required to obtain replacement contracts, including the manufacture and installation of the cogeneration or chiller equipment and the costs to incorporate this equipment into a facility are significant. To the extent that we do not have sufficient liquidity, our ability to add new contracts with energy production sites may be adversely impacted.
Our revenue from energy billing may be adversely impacted by increases in the price of natural gas, reductions in utility rates for electrical power, weather conditions, or by an increase in remote work and study environments, all of which could reduce our revenue.
Over the past several years electric rates have fluctuated, in some instances the rate have decreased, subsequent to the vast majority of customer contract dates, causing the billable value of the electrical power generated by our systems to decrease which has an adverse effect on our results of operations. In warmer months the customers do not use as much thermal energy because they do not have as much demand for heat at their locations. Due to lower demand in warmer months, we may not be able to bill for thermal energy and in turn may have a decrease in revenue. In addition, increases in the cost of natural gas may increase the cost of power generation in comparison to the cost of power from the electric grid and may result in decreased revenue and adversely affect our results of operation. Increased remote work and remote study environments during the COVID-19 pandemic has resulted in decreased commercial electricity and revenue generated by our systems, and has adversely affected our results of operations.
Our financial condition and results of operations could suffer if there is an impairment of goodwill or intangible assets.
As of December 31, 2022, our goodwill was $2,406,156, and our intangible assets were $997,594. We performed a goodwill impairment test at December 31, 2022 and determined that the estimated fair value of the energy production business assets, based on a discounted cash flow analysis, exceeded the carrying value of the assets and did not recognize goodwill impairment relating to our energy production segment for the year ended December 31, 2022. We are required to test intangible assets with indefinite lives, including goodwill, annually or, in certain instances, more frequently, and may be required to record impairment charges, which would reduce any earnings or increase any loss for the period in which the impairment was determined to have occurred. Our goodwill impairment analysis is sensitive to changes in key assumptions used in our analysis. If the assumptions used in our analysis are not realized, it is possible that an impairment charge may need to be recorded in the future. We cannot accurately predict the amount and timing of any impairment of goodwill or other intangible assets. However, any such impairment would have an adverse effect on our results of operations.
Risks Related to our Technology and Business Operations
If we are unable to maintain our technological expertise in design and manufacturing processes, we will not be able to successfully compete.
We believe that our future success will depend upon our ability to continue to develop and provide innovative products and product enhancements that meet the increasingly sophisticated needs of our customers. However, this requires that we successfully anticipate and respond to technological changes in design and manufacturing processes in a cost-effective and timely manner. The development of new, technologically advanced products and enhancements is a complex and uncertain process requiring high levels of innovation, as well as the accurate anticipation of technological and market trends. There can be no assurance that we will successfully identify new product opportunities, develop and bring new or enhanced products to market in a timely manner, successfully lower costs, and achieve market acceptance of our products, or that products and technologies developed by others will not render our products or technologies obsolete or noncompetitive.
The introduction of products embodying new technologies and the shifting of customer demands or changing industry standards could render our existing products obsolete and unmarketable. We may experience delays in releasing new products and product enhancements in the future. Material delays in introducing new products or product enhancements may cause customers to forego purchases of our products and purchase those of our competitors.
Legal, Regulatory and Compliance Risks
Our business is subject to product liability and warranty claims.
Our business exposes us to potential product liability claims, which are inherent in the manufacturing, marketing and sale of our products, and we may face substantial liability for damages resulting from the faulty design of products, manufacture of products or improper use of products by end users. We currently maintain product liability insurance, but there can be no assurance that this insurance will provide sufficient coverage in the event of a claim. Also, we cannot predict whether we will be able to maintain such coverage on acceptable terms, if at all, or that a product liability claim would not harm our business or financial condition. In addition, negative publicity in connection with the faulty design or manufacture of our products would adversely affect our ability to market and sell our products.
We sell our products with limited warranties. There can be no assurance that the provision in our financial statements for estimated product warranty expense will be sufficient. There can be no assurance that our efforts to reduce our risk through warranty disclaimers will effectively limit our liability. Any significant occurrence of warranty expense in excess of estimates could have a material adverse effect on our operating results, financial condition and cash flow. Further, we have at times undertaken programs to enhance the performance of units previously sold. These enhancements have at times been provided at no cost or below our cost. If we choose to offer such programs again in the future, such actions could result in significant costs.
Agreements with our customers may include potential liquidated damages relating to construction delays or performance guaranties.
Turnkey construction contracts to which we are a party may contain liquidated damages provisions resulting from failure to achieve agreed milestones relating to construction activity. Agreements relating to the sale of equipment or energy may include performance and other obligations that may result in payment obligations to customers.
Utilities or governmental entities could hinder our entry into and growth in the marketplace, and we may not be able to effectively sell our products.
Utilities or governmental entities on occasion have placed barriers to the installation of our products or their interconnection with the electric grid, and they may continue to do so. Utilities may charge additional fees to customers who install on-site CHP and rely on the grid for back-up power. These types of restrictions, fees, or charges could make it harder for customers to install our products or use them effectively, as well as increase costs to potential customers. This could make our systems less desirable, thereby adversely affecting our revenue and other operating results.
The reduction, elimination or expiration of government and economic incentives for applications of our equipment could reduce demand for our equipment and harm our business.
The market for cogeneration equipment depends in part on the availability and size of government and economic incentives that vary by geographic market. Because our sales to customers are typically into geographic areas with such incentives, elimination, or expiration of government subsidies and economic incentives for cogeneration equipment may negatively affect the competitiveness of equipment relative to other sources of electricity, heating, and cooling equipment, and could harm or halt the growth of the cogeneration industry and our business. For example, we are eligible for the New Jersey Smart Start Combined Heat and Power Incentive.
We may incorporate price reduction on equipment sold to customers based on the anticipated receipt of governmental economic incentive payments and apply and collect the incentives payments. If such incentives become unavailable to us our financial condition may be adversely affected.
Competing sources of electricity, heating, and cooling equipment may successfully lobby for changes in the relevant legislation in their markets that are harmful to the cogeneration industry. Reductions in, or eliminations or expirations of, governmental incentives in regions where we focus our sales efforts could result in decreased demand for and lower revenue
from cogeneration equipment there, which would adversely affect us. In addition, our ability to successfully penetrate new geographic markets may depend on new geographic areas adopting and maintaining incentives to promote cogeneration, to the extent such incentives are not currently in place. Additionally, electric utility companies may establish pricing structures or interconnection requirements that could adversely affect our sales and be harmful to cogeneration.
We may be exposed to substantial liability claims if we fail to fulfill our obligations to our customers or our on-site equipment malfunctions.
We enter into contracts with large commercial and not-for-profit customers under which we assume responsibility for meeting a portion of the customers' building energy demand and equipment installation. We may be exposed to substantial liability claims if we fail to fulfill our obligations to such customers. If the equipment malfunctions, it may be costly to repair or replace. There can be no assurance that we will not be vulnerable to claims by customers and by third parties that are beyond any contractual protections that we are able to negotiate. As a result, liability claims could cause us significant financial harm.
We may be subject to litigation, which is expensive and could divert management attention.
Our share price may be volatile and in the past companies that have experienced volatility in the market price of their stock have been subject to an increased incidence of securities class action litigation. Securities litigation against us could result in substantial costs and divert our management’s attention from other business concerns, which could seriously harm our business.
Although we maintain directors’ and officers’ insurance coverage, there can be no assurances that this insurance coverage will be sufficient to cover the substantial fees and expenses of lawyers and other professional advisors relating to any future litigation, our obligations to indemnify our officers and directors who are or may become parties to such pending and future actions, or the amount of any judgments or settlements that we may be obligated to pay in connection with such actions. We may be required to make material payments in connection with the defense of or to settle such litigation or to satisfy any adverse judgment. In addition, actions that arise in the future could be excluded from coverage or, if covered, could exceed our deductibles and/or the coverage provided. In addition, an adverse outcome of litigation could cause our insurance premiums and retention amounts to increase in the future. Any of these consequences could have a material adverse effect on our business, financial condition and results of operations. For more information regarding litigation, see "Item 3. Legal Proceedings" and Note 11 "Commitments and Contingencies" in the Notes to our Consolidated Financial Statements included elsewhere herein.
Credit and Liquidity Risks
We are exposed to credit risks with respect to some of our customers.
To the extent our customers do not advance us sufficient funds to finance our costs during the execution phase of our contracts, we are exposed to the risk that they may be unable to accept delivery or that they will be unable to make payment at the time of delivery or within agreed upon payment terms. Our provision for doubtful accounts receivable was $361,197 as of December 31, 2022, a decrease of $188,009 when compared to the provision for doubtful accounts as of December 31, 2021. We have experienced customer payment delays due to COVID-19, which are attributable to temporary business shutdowns, resulting in declines in revenues and cash flows from our customers and delays in project completion due to delays in government project inspections and a general slowdown in business activity and in some cases, customers ceasing business activities altogether.
Risks Relating to Ownership of our Common Stock
Investment in our Common Stock is subject to price fluctuations and market volatility.
Historically, valuations of many small companies have been highly volatile. The securities of many small companies have experienced significant price and trading volume fluctuations unrelated to the operating performance or the prospects of such companies. The market price of shares of our common stock could be subject to wide fluctuations in response to many risk factors listed in this section, and others beyond our control, including:
•results and timing of our product development;
•results of the development of our competitors’ products;
•regulatory actions with respect to our products or our competitors’ products;
•actual or anticipated fluctuations in our financial condition and operating results;
•actual or anticipated changes in our growth rate relative to our competitors;
•actual or anticipated fluctuations in our competitors’ operating results or changes in their growth rate;
•competition from existing products or new products that may emerge;
•announcements by us or our competitors of significant acquisitions, strategic partnerships, joint ventures, collaborations, or capital commitments;
•issuance of new or updated research or reports by securities analysts;
•fluctuations in the valuation of companies perceived by investors to be comparable to us;
•share price and volume fluctuations attributable to inconsistent trading volume levels of our shares;
•additions or departures of key management or personnel;
•disputes or other developments related to proprietary rights, including patents, litigation matters, and our ability to obtain, maintain, defend or enforce proprietary rights relating to our products and technologies;
•announcement or expectation of additional financing efforts;
•sales of our Common Stock by us, our insiders, or our other stockholders; and
•general economic and market conditions.
Furthermore, during the COVID-19 pandemic and at other times, the U.S. stock markets have experienced extreme price and volume fluctuations that have affected and continue to affect the market prices of equity securities of many companies. These fluctuations often have been unrelated or disproportionate to the operating performance of those companies. These broad market and industry fluctuations, as well as general economic, political, and market conditions such as recessions, interest rate changes, or international currency fluctuations, may negatively impact the market price of shares of our common stock. In addition, such fluctuations could subject us to securities class action litigation, which could result in substantial costs and divert our management’s attention from other business concerns, which could potentially harm our business.
If securities or industry analysts do not publish research or publish inaccurate or unfavorable research about our business, our share price and trading volume could decline.
The trading market for our shares will depend on the research and reports that securities or industry analysts publish about us or our business. There can be no assurance that analysts will cover us or provide favorable coverage. If one or more analysts downgrade our shares or change their opinion of our share price our share price may decline. In addition, if one or more analysts cease coverage of us or fails to regularly publish reports on us, we could lose visibility in the financial markets, which could cause our share price or trading volume to decline.
Because our directors and executive officers are among our largest stockholders, they can exert influence over our business and affairs and have actual or potential interests that may differ from other stockholders or investors.
As of the date of this report, our directors and executive officers collectively beneficially own approximately 11.4% of our issued and outstanding shares. John Hatsopoulos, a director, beneficially owns approximately 9.4% of our issued and outstanding shares. Additionally, the holdings of our directors and executive officers may increase in the future upon vesting or exercise of the options or other stock awards they may hold or in the future may be granted or if they otherwise acquire additional shares in the open market or otherwise. The interests of such persons may differ from the interests of our other stockholders. As a result, in addition to their board seats and offices, such persons will have influence over corporate actions requiring shareholder approval. These matters would include the election of directors and the approval of mergers or other business combination transactions.
Such persons’ stock ownership may discourage a potential acquirer from making a tender offer or otherwise attempting to acquire us, which in turn could reduce our stock price or prevent our stockholders from realizing a premium over our stock price.
Current stock holdings may be diluted if we make future equity issuances or if outstanding options are exercised for shares of our common stock.
“Dilution” refers to the reduction in the voting effect and proportionate ownership interest of a given number of shares of common stock as the total number of shares increases. Our issuance of additional stock, convertible preferred stock, or convertible debt may result in dilution to the interests of shareholders and may also result in the reduction of your stock price. The sale of a substantial number of shares into the market, or even the perception that sales could occur, could depress the price of our common stock. Also, the exercise of options may result in additional dilution.
The holders of outstanding options, warrants and convertible securities or derivatives, if any, have the opportunity to profit from a rise in the market price of our shares, if any, without assuming the risk of ownership, with a resulting dilution in the interests of other stockholders. We may find it more difficult to raise additional equity capital if it should be needed for our business while the options, warrants and convertible securities are outstanding.
Future sales of our shares by our existing stockholders may cause our stock price to fall.
The market price of our shares could decline as a result of sales by our existing stockholders of our shares in the market or the perception that these sales could occur. These sales might also make it more difficult for us to conduct an equity or equity-based financing at a time and price that we deem appropriate and thus inhibit our ability to raise additional capital when it is needed.
Because we have not and do not intend to pay cash dividends, our stockholders receive no current income from holding our stock.
We have paid no cash dividends on our capital stock to date and we currently intend to retain our future earnings, if any, to fund the development and growth of our business. We currently expect to retain earnings for use in the operation and expansion of our business, and therefore do not anticipate paying any cash dividends in the foreseeable future. As a result, capital appreciation, if any, of our Common Stock could be the sole source of gain for our stockholders for the foreseeable future.
We incur substantial costs to operate as a public reporting company.
We incur substantial legal, financial, accounting and other costs and expenses to operate as a public reporting company. We believe that these costs are a disproportionately larger percentage of our revenues than they are for many larger companies. In addition, the rules and regulations of the SEC impose significant requirements on public companies, including ongoing disclosure obligations and mandatory corporate governance practices. Our senior management and other personnel need to devote a substantial amount of time to ensure ongoing compliance with these requirements. Our common stock is currently quoted on the OTC Markets Group Inc.’s OTCQX Best Market tier. Under the OTC Markets Group Inc.’s OTCQX continued qualification requirements, we are required to have a minimum bid price of $0.10 per share as of the close of business for at least one of every 30 consecutive calendar days, a market capitalization of at least $5 million for at least one of every 30 consecutive calendar days, and at least two market makers. Also, we must be current in our SEC reporting obligations. If we seek to list our stock for trading on a national securities exchange or be quoted on the Nasdaq Stock Market, we will be subject to additional disclosure and governance obligations. There can be no assurance that we will continue to meet all of the public company requirements to which we are subject on a timely basis, or at all, or that our compliance costs will not continue to be material.
Because our common stock is not traded on a national securities exchange, our stock has limited liquidity and our ability to raise capital is impaired.
On June 19, 2020, we voluntarily delisted our common stock from Nasdaq and transitioned the quotation of our shares to OTC Markets Group Inc.’s OTCQX Best Market. Our common stock has been quoted on the OTC Markets Group Inc.’s OTCQX Best Market since June 19, 2020 under the symbol “TGEN”. We believe that trading “over the counter” has limited our stock’s liquidity and may impair our ability to raise additional capital. Also, and as a result, relatively small trades in our stock could have a disproportionate effect on our stock price.
Certain provisions of our charter and bylaws may discourage mergers and other transactions.
Certain provisions of our certificate of incorporation and bylaws may make it more difficult for someone to acquire control of the company. These provisions may make it more difficult for stockholders to take certain corporate actions and could delay or prevent someone from acquiring our business. These provisions could limit the price that certain investors might be willing to pay for shares of our common stock. The ability to issue “blank check” preferred stock is a traditional anti-takeover measure. This provision may be beneficial to our management and the board of directors in a hostile tender offer and may have an adverse impact on stockholders who may want to participate in such tender offer, or who may want to replace some or all of the members of the board of directors.
Our board of directors may issue shares of preferred stock without stockholder approval.
Our certificate of incorporation authorizes the issuance of up to 10,000,000 shares of preferred stock. Accordingly, our board of directors may, without shareholder approval, issue one or more new series of preferred stock with rights which could adversely affect the voting power or other rights of the holders of outstanding shares of our common stock. In addition, the issuance of shares of preferred stock may have the effect of rendering more difficult or discouraging, an acquisition or change of control of the company. Although we do not have any current plans to issue any shares of preferred stock, we may do so in the future.
In order to comply with public reporting requirements, we must continue to strengthen our financial systems and internal controls, and failure to do so could adversely affect our ability to provide timely and accurate financial statements.
Refinement of our internal controls and procedures will be required as we manage future growth and operate effectively as a public company. Such refinement of our internal controls, as well as compliance with the Sarbanes-Oxley Act of 2002 and related requirements, is costly and puts a significant burden on management. We cannot assure you that measures already taken, or any future measures, will enable us to provide accurate and timely financial reports, particularly if we are
unable to hire additional personnel in our accounting and financial department, or if we lose personnel in this area. Any failure to improve our disclosure controls or other problems with our financial systems or internal controls could result in delays or inaccuracies in reporting financial information, or non-compliance with SEC reporting and other regulatory requirements, any of which could adversely affect our business and stock price.
Investor confidence in the price of our stock may be adversely affected if we are unable to comply with Section 404 of the Sarbanes-Oxley Act of 2002. As of the end of the period covered by this report, our principal executive officers and our principal financial officer have concluded there is a material weakness in our disclosure controls and procedures and our internal control over financial reporting, which could harm our operating results or cause us to fail to meet our reporting obligations.
Our Chief Executive Officer and Chief Financial Officer (“certifying officers”) are responsible for establishing and maintaining our disclosure controls and procedures (as defined in Exchange Act Rule 13a-15(e) and 15d-15(e)). The certifying officers designed such disclosure controls and procedures, or caused such disclosure controls and procedures to be designed under their supervision, to ensure that information required to be disclosed by us in the reports that we file or submit under the Securities Exchange Act is recorded, processed, summarized and reported, within the time periods specified by the SEC’s rules and forms, and is made known to management (including the certifying officers) by others within the company, including its subsidiaries. We regularly evaluate the effectiveness of our disclosure controls and procedures and report our conclusions about the effectiveness of the disclosure controls quarterly in our Forms 10-Q and annually in our Forms 10-K. In completing such reporting, we disclose, as appropriate, any significant change in our internal control over financial reporting that occurred during our most recent fiscal period that has materially affected, or is reasonably likely to materially affect, our internal control over financial reporting.
As a public company, we are subject to the rules adopted by the SEC pursuant to Section 404 of the Sarbanes-Oxley Act of 2002, which require us to include in our annual report on Form 10-K our management’s report on, and assessment of the effectiveness of, our internal control over financial reporting (“management’s report”). If we fail to achieve and maintain the adequacy of our disclosure control or internal control over financial reporting, there is a risk that we will not comply with all of the requirements imposed by Section 404. Moreover, effective internal control over financial reporting, particularly that relating to revenue recognition, is necessary for us to produce reliable financial reports and is important in helping to prevent financial fraud. Any of these possible outcomes could result in an adverse reaction in the financial marketplace due to a loss in investor confidence in the reliability of our financial statements, which ultimately could harm our business and could negatively impact the market price of our common stock. Investor confidence and the price of our common stock may be adversely affected if we are unable to comply with Section 404 of the Sarbanes-Oxley Act of 2002.
As of the end of the period covered by this Annual Report, December 31, 2022, our principal executive officer and principal financial officer performed an evaluation of our disclosure controls and procedures and concluded that our controls were not effective to provide reasonable assurance that information required to be disclosed by us in reports that we file under the Securities Exchange Act, is recorded, processed, summarized and reported when required. Management conducted an evaluation of our internal control over financial reporting and based on this evaluation, management concluded that the company’s internal control over financial reporting was not effective as of December 31, 2022. We have a small number of employees dealing with general controls over information technology security and user access. This constitutes a material weakness in financial reporting. Any failure to implement effective internal controls could harm our operating results or cause us to fail to meet our reporting obligations. Inadequate internal controls could also cause investors to lose confidence in our reported financial information, which could have a negative effect on the trading price of our common stock and may require us to incur additional costs to improve our internal control system.
General Business Risks
Our intellectual property may not be adequately protected.
We seek to protect our intellectual property rights through patents, trademarks, copyrights, trade secret laws, confidentiality agreements, and licensing arrangements, but we cannot ensure that we will be able to adequately protect our technology from misappropriation or infringement. We cannot ensure that our existing intellectual property rights will not be invalidated, circumvented, challenged, or rendered unenforceable.
Our competitors may successfully challenge the validity of our patents, design non-infringing products, or deliberately infringe our patents. There can be no assurance that other companies are not investigating or developing other similar technologies. In addition, our intellectual property rights may not provide a competitive advantage to us or ensure that our products and technology will be adequately covered by our patents and other intellectual property. Any of these factors or the expiration, termination, or invalidity of one or more of our patents may have a material adverse effect on our business.
Others may assert that our technology infringes their intellectual property rights.
We may be subject to infringement claims from time to time. The defense of any claims of infringement made against us by third parties could involve significant legal costs and require our management to divert time from our business operations. If we are unsuccessful in defending any claims of infringement, we may be forced to obtain licenses or to pay additional royalties to continue to use our technology. We may not be able to obtain any necessary licenses on commercially reasonable terms or at all. If we fail to obtain necessary licenses or other rights, or if these licenses are costly, our operating results would suffer either from reductions in revenues through our inability to serve customers or from increases in costs to license third-party technologies.
Our business and financial performance may be adversely affected by information systems interruptions, cybersecurity attacks or other disruptions which could have a material adverse effect on our business and results from operations.
We depend upon information technology, infrastructure, including network, hardware and software systems to conduct our business. Despite our implementation of network and other cybersecurity measures, our information technology system and networks could be disrupted or experience a security breach from computer viruses, break-ins and similar disruptions from unauthorized tampering with our computer systems. Our security measures may not be adequate to protect against highly targeted sophisticated cyber-attacks, or other improper disclosures of confidential and/or sensitive information. Additionally, we may have access to confidential or other sensitive information of our customers, which despite our efforts to protect, may be vulnerable to security breaches, theft, or improper disclosure any of which could have a material adverse effect on our competitive position, results of operations, cash flows or financial condition.
Our success is dependent upon attracting and retaining highly qualified personnel and the loss of key personnel could significantly hurt our business.
To achieve success, we must attract and retain highly qualified technical, operational and executive employees. The loss of the services of key employees or an inability to attract, train and retain qualified and skilled employees, specifically engineering, operations, and business development personnel, could result in the loss of business or could otherwise negatively impact our ability to operate and grow our business successfully.
Our business may be impacted by political events, war, terrorism, public health issues, natural disasters and other circumstances that are not within our control.
War, terrorism, geopolitical uncertainties, public health issues, and other business interruptions have caused and could cause damage or disruption to international commerce and the global economy, and thus could have a material adverse effect on us, our suppliers, and manufacturing vendors. Our business operations are subject to interruption by natural disasters, fire, power shortages, nuclear power plant accidents, terrorist attacks, and other hostile acts, labor disputes, public health issues, and other events beyond our control. Such events could decrease demand for our products, make it difficult or impossible for us to make and deliver products to our customers, or to receive products from our manufacturers and suppliers, and create delays and inefficiencies in our supply chain. If major public health issues, including pandemics, arise, we could be adversely affected by more stringent employee travel restrictions, additional limitations in freight services, governmental actions limiting the movement of products between regions, delays in production ramps of new products, and disruptions in the operations of our manufacturing vendors and suppliers. In the event of a natural disaster, we could incur significant losses, require substantial recovery time and experience significant expenditures in order to resume operations.
We depend on a small number of customers for a substantial portion of our product revenues. The loss of one or more of these customers, or our inability to collect outstanding receivables from such customers could have a material adverse effect on our financial results.
There was one customer who represented 12% of revenues for the year ended December 31, 2022 and no customer who represented more than 10% of revenues for the year ended December 31, 2021. There was one customer who represented 15% of the accounts receivable balance as of December 31, 2022, and two customers who represented 14% and 12%, respectively, of the accounts receivable balance as of December 31, 2021. The loss of any one or more of our major customers or our inability to collect on outstanding accounts receivable from one or more of these customers could have a material adverse effect on our business and financial condition. Our provision for doubtful accounts receivable decreased $188,009 to $361,197 in the year ended December 31, 2022, compared to the year ended December 31, 2021. We continue to seek to increase our customer base and reduce our reliance on a limited number of customers. Although we are seeking to diversify our customer base and reduce our reliance upon sales to a small number of customers, we expect sales to such customers to continue to constitute a significant portion of our revenues in the near term given we actively pursue large contracts and projects. The loss of any one or more of such customers or an inability to collect such accounts receivable could have a material adverse effect our business, financial condition and results of operations.
Item 1B. Unresolved Staff Comments.
None.
Item 2. Properties.
Our headquarters is located in Waltham, Massachusetts, and consists of approximately 43,000 square feet of manufacturing, storage and office space. Although our Waltham lease expires March 31, 2024, we have identified an alternate space and are currently negotiating the lease terms. Currently, our monthly base rent is $44,254. We believe that our facilities are appropriate and adequate for our current needs.
Our eleven leased service centers can be broken into two different sizes. The larger leased spaces have office space to accommodate administrative, sales and engineering personnel, and warehouse space to stock parts in support of our service contracts. As of December 31, 2022, the service centers that fit this larger category are based in Piscataway, New Jersey and Valley Stream and Buchanan, New York to service the Metro New York City and the Mid-Atlantic region. The San Francisco Bay area and Northern California is served by such a center in Hayward, California. A portion of the corporate headquarters in Waltham, Massachusetts is used in this manner to service Boston and New England. The smaller service centers are parts depots or warehouses for the stocking of parts in support of our service contracts. These centers are located in Los Angeles, California; Sterling Heights, Michigan; Newark, New York, East Windsor, Connecticut; Toronto, Ontario and Wellesley Chapel, Florida.
Item 3. Legal Proceedings.
On November 23, 2022, we were served with a suit filed against us on August 24, 2022 in the Ontario Superior Court of Justice for damages in the amount of CDN $1,000,000, alleging that a Tecogen cogenerator installed by us at the plaintiffs facility caught fire, causing damage to the cogenerator and the plaintiff's facility. For the year ended December 31, 2022, we reserved $150,000 for anticipated costs which may not be covered by insurance. We are not a party to any other material pending legal proceeding.
Item 4. Mine Safety Disclosures.
Not applicable.
PART II
Item 5. Market for Registrant’s Common Equity, Related Stockholder Matters and Issuer Purchases of Equity Securities.
Market for Our Shares
Our common stock is quoted on the OTC Markets Group’s OTCQX Best Market tier and trades under the symbol TGEN. As of March 23, 2023, there were 57 holders of record of our common stock. Any over-the-market quotations reflect inter-dealers prices, without mark-up, markdown or commission and may not necessarily represent actual transactions.
Dividends
We have never declared or paid a cash dividend on our common stock and do not anticipate paying cash dividends on our common stock in the foreseeable future. Payment of future cash dividends, if any, will be at the discretion of our board of directors and will depend on our financial condition, results of operations, contractual restrictions and covenants included under any bank or other indebtedness that we may enter into, capital requirements, business prospects and other factors that our board of directors considers relevant.
Equity Compensation Plan Information
We adopted the 2006 Stock Option and Incentive Plan (the “Plan”), under which the board of directors may grant incentive or non-qualified stock options and stock grants to key employees, directors, advisors and our consultants. The Plan was amended at various dates by the Board of Directors to increase the reserved shares of common stock issuable under the Plan to 3,838,750 as of December 31, 2022, and in June 2017 stockholders approved an amendment to extend the termination date of the Plan to January 1, 2026 and to ratify all of our option grants issued after January 1, 2016 (the “Amended Plan”).
Stock options vest based upon the terms within the individual option grants, with an acceleration of the unvested portion of such options upon a change in control event, as defined in the Amended Plan. The options are not transferable except by will or domestic relations order. The option price per share under the Amended Plan cannot be less than the fair market value of the underlying shares on the date of the grant. The number of shares remaining available for future issuance under the Amended Plan as of December 31, 2022 and 2021 was 146,393 and 764,768, respectively.
We adopted the 2022 Stock Incentive Plan (the "2022 Plan"), under which the Board of Directors may grant incentive or non-qualified stock options and stock grants to key employees, directors, advisors and consultants. We have reserved 3,800,000 shares of our common stock for issuance pursuant to awards under the 2022 Plan. The adoption of the 2022 Plan was approved by our shareholders on June 9, 2022.
Under the 2022 Plan, stock options vest based upon the terms within the individual option grants, with an acceleration of the unvested portion of such options upon a change in control event, as defined in the 2022 Plan. The options are not transferable except by will or domestic relations order. The option price per share under the 2022 Plan cannot be less than the fair market value of the underlying shares on the date of the grant. The number of shares remaining available for future issuance under the 2022 Plan as of December 31, 2022 was 3,600,000.
The following table provides information as of December 31, 2022, regarding Common Stock that may be issued under the Amended Plan and the 2022 Plan.
| | | | | | | | | | | | | | | | | | | | |
| | Number of securities to be issued upon exercise of outstanding options, warrants and rights | | Weighted-average exercise price of outstanding options, warrants and rights | | Number of securities remaining available for future issuance under equity compensation plans (excluding securities reflected in first column) |
| Equity compensation plans approved by security holders | | 3,204,297 | | | $ | 1.61 | | | 3,746,393 | |
| Equity compensation plans not approved by security holders | | — | | | — | | | — | |
| Total | | 3,204,297 | | | $ | 1.61 | | | 3,746,393 | |
Item 6. [Reserved].
Item 7. Management's Discussion and Analysis of Financial Condition and Results of Operations.
You should read the following discussion and analysis of our financial condition and results of operations together with our consolidated financial statements and related notes appearing elsewhere in this Annual Report on Form 10-K. Some of the information contained in this discussion and analysis or set forth elsewhere in this Annual Report on Form 10-K, including information with respect to our plans and strategy for our business, includes forward-looking statements that involve risks and uncertainties. You should review “Item 1A. Risk Factors” of this Annual Report on Form 10-K for a discussion of important factors that could cause actual results to differ materially from the results described in or implied by the forward-looking statements contained in the following discussion and analysis.
Overview
Tecogen designs, manufactures, markets, and maintains high efficiency, ultra-clean cogeneration products. These include natural gas engine driven combined heat and power (CHP) systems, chillers and heat pumps for multi-family residential, commercial, recreational and industrial use. We are known for products that provide customers with substantial energy savings, resiliency from utility power outages and for significantly reducing a customer’s carbon footprint. Our products are sold with our patented Ultera® technology which nearly eliminates all criteria pollutants such as NOx and CO. Our systems are greater than 88% efficient compared to typical electrical grid efficiencies of 40% to 50%. As a result, our greenhouse gas (GHG) emissions are typically half that of the electrical grid. Our systems generate electricity and hot water or in the case of our Tecochill product, both chilled water and hot water. These result in savings of energy related costs of up to 60% for our customers. Our products are expected to run on Renewable Natural Gas (RNG) as it is introduced into the US gas pipeline infrastructure.
Our products are sold directly to end-users by our in-house sales team and by established sales agents and representatives. We have agreements in place with distributors and sales representatives. Our existing customers include hospitals and nursing homes, colleges and universities, health clubs and spas, hotels and motels, office and retail buildings, food and beverage processors, multi-unit residential buildings, laundries, ice rinks, swimming pools, factories, municipal buildings, military installations and indoor growing facilities. To date we have shipped over 3,150 units, some of which have been operating for almost 35 years.
Although we may, from time to time, have one or a few customers who may represent more than 10% of our product revenue for a given year, we are not dependent on the recurrence of revenue from those customers. Our product revenue is such that customers may make a large purchase once and may not ever make a purchase again. Our equipment is built to last 30 or more years. Therefore, our product revenue model is not dependent on recurring sales transactions from the same customer. Our service revenue does lend itself to recurring revenue from particular customers.
For the last two fiscal years, more than half of our revenue was generated from long-term maintenance and energy production contracts, which provides us with a predictable revenue stream, especially during the summer months. We experience a slight surge of activity from May through September as our “chiller season” is in full swing. Our O&M service
revenue which has grown from year to year since 2005, with our New York City/New Jersey and New England systems experiencing the majority of the growth, was impacted to some extent by the COVID-19 pandemic. Our installation service related revenue has decreased and is likely to continue to remain low due to our strategy to focus on higher margin segments of our business. Our service margins are generally predictable as we service hundreds of long-term contracts with relatively low dollar, high volume sales.
During the years ended December 31, 2022 and 2021, our revenues were negatively impacted due to customer order delays or deferrals; service delays due to customer facility closures, in some cases for extended periods; and a reduction in our energy production segment revenue due to business closures and increased remote work and learning environments. The extent to which the coronavirus will continue to impact our business and our financial results will depend on future developments, which are highly uncertain and cannot be predicted.
Our product revenue is derived from the sale of the various cogeneration modules, such as the InVerde, InVerde e+, the Tecopower, Ilios heat pumps, and Tecochill products. In 2019, we also reintroduced our TecoFrost refrigeration line. The sales cycle varies between 6 months to a year or more. Therefore, our product revenue can be difficult to predict and the expected margin can vary. In most cases we work with consulting engineers who specify our product in new and retrofit applications. We also work with building owners directly, in some limited cases offering a full turn-key installation.
Our cogeneration, heat pump, and chiller modules are built to order and revenue is recognized upon shipment. The lead time to build and deliver a unit depends on its customized configuration and is approximately 12 to 14 weeks for a chiller and 6 to 8 weeks for a cogeneration system or heat pump, from time of purchase order. As revenue is recognized upon shipment, our work-in-process is an important factor in understanding our financial condition in any given quarter.
Our operations are comprised of three business segments, as follows:
•Products segment - designs, manufactures and sells industrial and commercial cogeneration systems;
•Services segment - provides maintenance services for Tecogen supplied products at customer sites; and,
•Energy Production segment - sells energy in the form of electricity, heat, hot water, and cooling to our customers under long-term sales agreements.
Recent Developments
Assumption of Aegis Energy Services Maintenance Agreements
On March 15, 2023, we entered into an Agreement with Aegis Energy Services, LLC (“Aegis”) regarding the assignment and assumption of certain maintenance agreements, the purchase and sale of certain assets, and related matters (the “Agreement”) pursuant to which we agreed to assume Aegis’ rights and obligations arising on or after April 1, 2023 (the anticipated closing date) under Maintenance Agreements for 202 cogeneration systems, and acquire certain vehicles and inventory used in connection with the performance of maintenance services. The Agreement also provides that we will hire certain Aegis employees who will continue to provide maintenance services relating to the cogeneration systems, and that Aegis will provide transitional services relating to the assumed Maintenance Agreements. At the closing, we will acquire certain Aegis vehicles for $170,000, and between the closing and June 30, 2023, we will acquire from Aegis inventory used to provide maintenance services in exchange for a credit of $300,000 to be used for purchases by Aegis of our cogeneration equipment on or before June 30, 2023. Following the closing, for a period of up to seven years, we will pay Aegis a portion of the revenue collected for maintenance services provided pursuant to the assumed Maintenance Agreements. We also have the right to assume Aegis’ remaining Maintenance Agreements for cogeneration systems on the same terms and conditions but effective December 31, 2023 to the extent that Aegis is permitted to assign such agreements to us in accordance with the terms of such agreements.
Tecochill Hybrid-Drive Air-Cooled Chiller Development
During the third quarter of 2021 we began development of the Tecochill Hybrid-Drive Air-Cooled Chiller. We recognized that there were many applications where the customer wanted an easy to install roof top chiller. Using the inverter design from our InVerde e+ cogeneration module, the system can simultaneously take two inputs, one from the grid or a renewable energy source and one from our natural gas engine. This allows a customer to seek the optimum blend of operational cost savings and greenhouse gas benefits while providing added resiliency from two power sources. We introduced the Tecochill Hybrid-Drive Air-Cooled Chiller at the AHR Expo in February 2023 and expect to see incremental revenue in the fourth quarter of 2023. A patent application based on this concept has been filed with the US Patent and Trademark Office.
Controlled Environment Agriculture: NetZero Greens
On July 20, 2022, we announced the establishment of NetZero Greens, a new business unit focused on low carbon Controlled Environment Agriculture (CEA). We believe that CEA offers an exciting opportunity to apply our expertise in clean
cooling, power generation, and greenhouse gas reduction to address critical issues affecting food and energy security. We propose to address this challenge by developing a highly efficient energy solution for CEA grown produce using our cogeneration products in conjunction with solar energy generation, energy storage, and other technologies.
CEA facilities enable multiple crop cycles (15 to 20 cycles) in one year compared to one or two crop cycles in conventional farming. In addition, growing produce close to the point of sale reduces food spoilage during transportation. Food crops grown in greenhouses typically have lower yields per square foot than in CEA facilities, and the push to situate facilities close to consumers in cities requires minimizing land area and maximizing yield per square foot. Yields are increased in CEA facilities by supplementing or replacing natural light with grow lights in a climate-controlled environment - which requires significant energy use.
In recent years our cogeneration equipment has been used in numerous cannabis cultivation facilities because our systems significantly reduce operating costs, reduce the facility GHG footprint and offer resiliency to grid outages. Our experience providing clean energy solutions to cannabis cultivation facilities has given us significant insight into requirements relating to energy-intensive indoor agriculture applications that we expect to be transferable to CEA facilities for food production.
Paycheck Protection Program Loan
On April 17, 2020, we obtained an unsecured loan in the principal amount of $1,874,200 from Webster Bank, NA ("Webster") under the Paycheck Protection Program adopted pursuant to the Coronavirus Aid, Relief and Economic Recovery Act, as amended ("CARES Act"). On January 19, 2021 we received confirmation from Webster that the Paycheck Protection Program Loan in the original principal amount of $1,874,200 together with accrued interest of $13,659 was forgiven in full effective as of January 11, 2021. The loan forgiveness of $1,887,859 was accounted for as a debt extinguishment and is reported as a separate component of other income (expense), net in our condensed consolidated statement of operations. The loan forgiveness is considered to be nontaxable for both state and federal purposes and has been treated accordingly in our condensed consolidated financial statements.
Paycheck Protection Program Second Draw Loan
On February 5, 2021, we obtained a Paycheck Protection Program Second Draw unsecured loan through Webster in the amount of $1,874,269 in connection with the Paycheck Protection Program pursuant to the CARES Act. On September 20, 2021, we received a letter dated September 13, 2021 from Webster confirming that the Paycheck Protection Program Second Draw Loan issued to us pursuant to the CARES Act in the original principal amount of $1,874,269 together with accrued interest of $11,386 was forgiven in full as of September 8, 2021. The loan forgiveness of $1,885,655 was accounted for as debt extinguishment and is reported as a separate component of other income (expense), net in our condensed consolidated statement of operations. The loan forgiveness is considered to be nontaxable for both state and federal purposes and has been treated accordingly in our condensed consolidated financial statements.
Employee Retention Credit
On March 27, 2020, the Coronavirus Aid, Relief, and Economic Security Act (“CARES Act”) was signed into law providing numerous tax provisions and other stimulus measures, including an employee retention credit (“ERC”), which is a refundable tax credit against certain employment taxes. The Taxpayer Certainty and Disaster Tax Relief Act of 2020 and the American Rescue Plan Act of 2021 extended and expanded the availability of the ERC.
As a result of our election to use an alternative quarter, we qualified for the ERC in the first, second and third quarters of 2021 because our gross receipts decreased by more than 20% from the first, second and third quarters of 2019. As a result of averaging 100 or fewer full-time employees in 2019, all wages paid to employees in the first, second and third quarters of 2021 were eligible for the ERC, other than wages with with loan forgiveness which cannot be used as qualified wages for purposes of the ERC.
During the three months ended June 30, 2021, we recorded an ERC benefit for the first and second quarters of 2021 of $713,269 and, in the three months ended September 30, 2021 we recorded an ERC benefit for the third quarter of 2021 of $562,752, respectively, in other income (expense), net in the our condensed consolidated statements of operations. A current receivable in the amount of $713,269 is included in our condensed consolidated balance sheet as of December 31, 2022. On April 14, 2022, we received $564,027 from the Internal Revenue Service representing the ERC claim for the third quarter of 2021 and $1,275 of accrued interest. We received $667,121 from the Internal Revenue Service on January 12, 2023 in payment of the ERC claimed from the first and second quarters of 2021 and $15,775 of accrued interest. We expect to receive the remaining balance of $46,148 in the second quarter of 2023.
Critical Accounting Policies
Our discussion and analysis of our financial condition and results of operations are based upon our consolidated financial statements, which have been prepared in accordance with accounting principles generally accepted in the United States. The preparation of these financial statements requires us to make judgments, assumptions and estimates that affect the
reported amounts of assets, liabilities, sales and expenses, and related disclosure of contingent assets and liabilities. These judgments, assumptions and estimates are made or applied within the context of accounting policies related to the nature of the transaction. Note 2. "Summary of Significant Accounting Policies" of the Notes to our Consolidated Financial Statements describes the significant accounting policies used in the preparation of the consolidated financial statements.
Certain aspects of certain accounting policies require management to make difficult, subjective or complex judgments that could have a material effect on our financial condition and results of operations. These aspects of these accounting policies are considered critical accounting policies. These policies may require management to make assumptions about matters that are highly uncertain at the time of the estimate or employ an estimate where alternative estimates could have also been employed, and may involve estimates that are reasonably likely to change with the passage of time. Estimates and assumptions about future events and their effects cannot be determined with certainty. We base our estimates on historical experience and on various other assumptions believed to be applicable and reasonable under the circumstances. These estimates may change as new events occur, as additional information is obtained and as our operating environment changes. These changes have historically been minor and have been included in the consolidated financial statements as soon as they became known. In addition, management is periodically faced with uncertainties, the outcomes of which are not within its control and will not be known for prolonged periods of time. These uncertainties are discussed in "Item 1A," “Risk Factors" above.
Management believes that the following are critical accounting policies:
Revenue Recognition
Revenue is recognized when performance obligations under the terms of a contract with our customer are satisfied. This generally occurs with the transfer of control of our products, services and energy production. Revenue is measured as the amount of consideration we expect to receive in exchange for transferring goods or providing services or energy to customers.
Determination of contract consideration allocatable to multiple performance obligations within a single contract requires employing stand-alone selling prices which may be based on observable selling prices, estimated selling prices or as a residual. We use an observable selling price to determine standalone selling prices where available and either a combination of an adjusted market assessment approach, an expected cost plus a margin approach, and/or a residual approach to determine the standalone selling prices for separate performance obligations as a basis for allocating contract consideration when an observable selling price is not available.
Under complete turnkey installation service contracts our performance obligation under such contracts is satisfied progressively over time as enhancements are made to customer owned and controlled properties. We measure progress towards satisfaction of the performance obligation based on an input method based on cost and revenue is recognized over time using the percentage-of-completion method determined on a cost-to-cost basis. This method requires management to estimate future cost to complete based on conditions and information available at the time the estimate is made. Events or changes in circumstances can cause these estimates to be revised which may result in significant adjustments to revenue amounts previously recognized.
Accounts Receivable
Accounts receivable are stated at the amount management expects to collect from outstanding balances. An allowance for doubtful accounts is provided for those accounts receivable considered to be uncollectible based upon historical experience and management’s evaluation of outstanding accounts receivable at the end of the year.
Inventory
Raw materials, work in process, and finished goods inventories are stated at the lower of cost, as determined by the average cost method, or net realizable value. We periodically review inventory quantities on hand for excess and/or obsolete inventory based primarily on historical usage, as well as based on estimated forecast of product demand. Any reserves that result from this review are charged to cost of sales.
Property, Plant and Equipment
Property, plant and equipment are recorded at cost. Depreciation is provided using the straight-line method over the estimated useful life of the asset, which range from three to fifteen years. Leasehold improvements are amortized using the straight-line method over the lesser of the estimated useful lives of the assets or the term of the related leases. Expenditures for maintenance and repairs are expensed currently, while renewals and betterments that materially extend the life of an asset are capitalized.
We review our property, plant and equipment for potential impairment whenever events or changes in business circumstances indicate that the carrying value of the assets may not be fully recoverable or that the useful lives of the assets are no longer appropriate. We evaluate the recoverability of our long-lived assets when impairment is indicated by comparing the net book value of the asset group to the estimated future undiscounted cash flows attributable to such assets. f the sum of the
projected undiscounted cash flows (excluding interest charges) is less than the carrying value of the assets, the assets will be written down to the estimated fair value and such loss is recognized in income from continuing operations in the period in which the determination is made. If impairment is indicated, the asset is written down to its estimated fair value.
Contract Assets and Liabilities
The favorable contract asset and unfavorable contract liability included in the intangible assets and liabilities of the consolidated balance sheets represent the fair value of customer energy production contracts (both positive for favorable contracts and negative for unfavorable contracts) which were acquired by us.
The determination of fair value requires development of an estimate of the price at which an orderly transaction to sell the asset or to transfer the liability would take place between market participants at the measurement date under current market conditions. Contracts are considered to be assets or liabilities by virtue of the rights and obligations inherent in the contract terms. Typically, contracts with terms considered to be at market are considered to have no fair value as, in order to be entitled to the rights under the contract, performance must occur for which a market rate of return is earned due to the at market terms. The fair value of a contract is primarily a measurement of its off-market terms. The obligation to perform under a contract with terms that are unfavorable to market results in a liability to the extent its terms are off market. The resulting liability is an estimate of the price that would need to be paid to a willing market participant to assume the obligations under the contract in order for them to receive a market rate of return for their remaining performance obligation under the contract. The exact opposite holds true in instances where the terms of a contract are considered to be favorable to market. In that case an asset would exist as an estimate of the price that would be received from a willing market participant in order to be entitled to the rights under the contract.
In determining the estimate of fair value of customer energy production contracts, the measure of market, and thus the baseline to measure the amount related to any of the off-market terms or conditions with respect to the contracts, was considered best determined, given the nature of the services provided under the contracts, by utilizing a benchmark level of margin, in this case 35% of revenue which is consistent with the average return on revenue of US investor owned public utilities.
Goodwill
Goodwill is not amortized; however, it is reviewed for impairment annually in the fourth quarter and/or when circumstances or other events indicate that impairment may have occurred. ASC 350 “Intangibles—Goodwill and Other” (ASC 350) permits entities to make a qualitative assessment of whether it is more likely than not that a reporting unit’s fair value is less than its carrying amount before applying the two-step goodwill impairment test. Circumstances that are considered as part of the qualitative assessment and could trigger the two-step impairment test include, but are not limited to: a significant adverse change in the business climate; a significant adverse legal judgment; adverse cash flow trends; an adverse action or assessment by a government agency; unanticipated competition; decline in our stock price; and a significant restructuring charge within a reporting unit. We define reporting units at the business segment level. For purposes of testing goodwill for impairment, goodwill has been allocated to our reporting units to the extent it relates to each reporting unit.
During 2018, we early-adopted the provisions of ASU 2017-04 which simplified goodwill impairment testing by eliminating the requirement to determine the implied value of goodwill where a quantitative analysis indicates that the carrying value of the reporting unit exceeds its fair value.
At a minimum, we perform a quantitative goodwill impairment test in the fourth quarter of the year. In the fourth quarter of 2022, we performed a quantitative goodwill impairment test for our energy production reporting unit acquired in 2017. We used a discounted cash flow approach to develop the estimated fair value of that reporting unit. Management judgment is required in developing the assumptions for the discounted cash flow model. An impairment would be recorded if the carrying amount of a reporting unit including goodwill exceeded the estimated fair value. Based on the aforementioned analysis, the carrying amount of that reporting unit, including goodwill, exceeded the estimated fair value and there was no impairment at December 31, 2022. See Note 5. "Sale of Energy Producing Assets and Goodwill Impairment".
The impairment analysis recognizes the shortening of remaining contract terms with customers without replacement and without further growth, as well as less than expected cost savings and, offset by profitability from our initiatives to optimize the long-term profitability of our various site operations, and a price peak of the Company's stock on the date of the business combination to which the goodwill relates (see also Note 5."Sale of Energy Producing Assets and Goodwill Impairment").
The discount rate, profitability assumptions, and terminal growth rate of this reporting unit were the material assumptions utilized in the discounted cash flow model used to estimate its fair value. The discount rate reflects an estimate of our weighted-average cost of capital.
The discounted cash flow analysis requires estimates, assumptions and judgments about future events. Our analysis uses our internally generated long-range plan. The long-range plan reflects management's judgment and assumptions about future events.
We believe the assumptions used in our goodwill impairment analysis are appropriate and result in a reasonable estimate of the fair value of the reporting unit. However, given the economic environment and the uncertainties regarding the impact on our business, there can be no assurance that our estimates and assumptions, made for purposes of our goodwill impairment testing, will prove to be an accurate prediction of the future. If our assumptions regarding future performance are not achieved, we may be required to record additional goodwill impairment charges in future periods.
Results of Operations
Year Ended December 31, 2022 Compared to Year Ended December 31, 2021
The following table sets forth for the periods indicated, the percentages of the net sales represented by certain items reflected in our statements of operations for the years ended December 31, 2022 and 2021:
| | | | | | | | | | | |
| Years ended December 31, |
| 2022 | | 2021 |
| Revenues | 100.0 | % | | 100.0 | % |
| Cost of Sales | 55.7 | | | 52.5 | |
| Gross Profit | 44.3 | | | 47.5 | |
| General and administrative | 43.6 | | | 40.1 | |
| Selling | 7.2 | | | 10.1 | |
| Research and development | 2.9 | | | 2.2 | |
| | | |
| | | |
| | | |
| Total operating expenses | 53.7 | | | 52.5 | |
| Loss from operations | (9.4) | | | (5.0) | |
| Total other income (expense), net | (0.1) | | | 20.4 | |
| Consolidated net income (loss) | (9.6) | | | 15.3 | |
| (Income) loss attributable to the noncontrolling interest | (0.2) | | | (0.2) | |
| Net income (loss) attributable to Tecogen Inc. | (9.8) | % | | 15.1 | % |
| | | |
The following table presents revenue by segment and the change from the prior year for the years ended December 31, 2022 and 2021:
| | | | | | | | | | | | | | | | | | | | | | | | | | |
| | Years Ended | | | | |
| Revenues | | December 31, 2022 | | December 31, 2021 | | Increase (Decrease) $ | | Increase (Decrease) % |
| Product: | | | | | | | | |
| Cogeneration | | $ | 5,279,569 | | | $ | 3,264,313 | | | $ | 2,015,256 | | | 61.7 | % |
| Chillers | | 5,034,633 | | | 5,723,157 | | | (688,524) | | | (12.0) | % |
| Engineered Accessories | | 841,897 | | | 1,145,859 | | | (303,962) | | | (26.5) | % |
| Total product revenue | | 11,156,099 | | | 10,133,329 | | | 1,022,770 | | | 10.1 | % |
| Service: | | | | | | | | |
| Service contracts | | 12,060,404 | | | 11,586,763 | | | 473,641 | | | 4.1 | % |
| Installations | | 257 | | | 938,831 | | | (938,574) | | | (100.0) | % |
| Total service revenue | | 12,060,661 | | | 12,525,594 | | | (464,933) | | | (3.7) | % |
| Energy production | | 1,785,854 | | | 1,739,150 | | | 46,704 | | | 2.7 | % |
| Total Revenue | | $ | 25,002,614 | | | $ | 24,398,073 | | | $ | 604,541 | | | 2.5 | % |
Revenues
Revenues in 2022 were $25,002,614 compared to $24,398,073 in 2021, an increase of $604,541 or 2.5% due to increased Product revenues.
Products
Product revenues in 2022 were $11,156,099 compared to $10,133,329 in 2021, an increase of $1,022,770 or 10.1%. The revenue increase in 2022 compared to 2021 is due primarily to an increase in cogeneration sales of $2,015,256, due to increased unit volume, which is partially offset by a $303,962 decrease in sales of engineered accessories and a decrease in chiller sales of $688,524. Our product mix, as well as product revenue, can vary significantly from period to period as our products are high dollar, low volume sales in which revenue is recognized upon shipment and to some degree were impacted by COVID-19 as energy and other construction projects were delayed.
Services
Revenues derived from our service centers, including installation activities, in 2022 were $12,060,661 compared to $12,525,594 for the same period in 2021, a decrease of $464,933 or 3.7%. The decrease in revenue in 2022 is due primarily to a decrease in installation revenues of $938,574, offset partially by an increase of $473,641, or 4.1%, in service contract revenues. Our service operation revenues grow with the sales of installed systems, since the majority of our product sales are accompanied by a service contract or time and materials agreements. As a result our “fleet” of units being serviced by our service department grows with product sales. Our installation activity is likely to continue to remain low due to our strategy to focus on higher margin segments of our business.
Energy Production
Energy production revenues for the year ended December 31, 2022 were $1,785,854 compared to $1,739,150 for 2021, an increase of $46,704, or 2.7%. The increase in energy production revenue is primarily due to our share of the excess revenue recognized in 2022 under the terms of the maintenance and operating agreements entered into in 2019 with the purchaser of certain energy producing assets, offset partially by the impact of COVID-19 resulting in the permanent closure of some hotel properties and a change to remote work and learning environments, resulting in decreased energy usage. During 2022 three of our energy production sites ceased operations.
Cost of Sales
Cost of sales in 2022 was $13,935,803 compared to $12,810,420 in 2021, an increase of $1,125,383 or 8.8%. The increase in cost of sales is due to increased product revenue volume and the impact of inflation on our material costs. Our overall gross margin was 44.3% in 2022 compared to 47.5% in 2021, a decrease of 3.2%.
Products
Costs of sales for products in 2022 was $7,413,320 compared to $5,601,046 in 2021, an increase of $1,812,274, or 32.4%, due to increased product revenue volume and higher material costs. Our products gross margin was 33.5% in 2022 compared to 44.7% in 2021, a decrease of 11.2%, due primarily to the impact of inflation on our material costs.
Services
Cost of sales for services in 2022 was $5,525,493 compared to $6,134,953 in 2021, a decrease of $609,460, or 9.9%, due to decreased installation activities. Our services gross margin was 54.2% in 2022 compared to 51.0% in 2021, an increase of 3.2%, due to lower installation services revenue.
Energy Production
Cost of sales for energy production for the year ended December 31, 2022 was $996,990 compared to $1,074,421 in 2021, a decrease of $77,431. Energy production gross margin was 44.2% in 2022 compared to 38.2% in 2021, an increase of 6%, due primarily to the recognition of our share of the excess revenue in 2022 under the terms of the maintenance and operating agreements entered into in 2019 with the purchaser of certain energy producing assets.
Operating Expenses
Operating expenses increased in 2022 to $13,415,952 compared to $12,806,745 in 2021, an increase of $609,207 or 4.8%.
| | | | | | | | | | | | | | | | | | | | | | | | | | |
| | Years Ended | | Increase (Decrease) |
| | December 31, 2022 | | December 31, 2021 | | $ | | % |
| Operating Expenses | | | | | | | | |
| General and administrative | | 10,909,251 | | | 9,795,823 | | | $ | 1,113,428 | | | 11.4 | % |
| Selling | | 1,811,085 | | | 2,471,929 | | | (660,844) | | | (26.7) | % |
| Research and development | | 732,873 | | | 542,079 | | | 190,794 | | | 35.2 | % |
| Gain on sale of assets | | (41,931) | | | (10,486) | | | (31,445) | | | 299.9 | % |
| Long-lived asset impairment | | 4,674 | | | 7,400 | | | (2,726) | | | (36.8) | % |
| Total | | $ | 13,415,952 | | | $ | 12,806,745 | | | $ | 609,207 | | | 4.8 | % |
General and administrative expenses increased $1,113,428 to $10,909,251 in the year ended December 31, 2022 compared to $9,795,823 in 2021 due primarily to a $311,710 increase in freight and other related costs, a $206,006 increase in payroll costs, a $150,000 provision for litigation, a $131,719 increase in stock-based compensation, a $124,403 increase in franchise taxes, a $122,497 increase in professional fees and a $76,370 increase in travel related expenses.
Selling expenses decreased in the year ended December 31, 2022 to $1,811,085 compared to $2,471,929 in 2021, a decrease of $660,844 due to a $189,691 decrease in payroll and related benefits and a $305,050 decrease in commissions.
Research and development expenses increased in the year ended December 31, 2022 to $732,873 compared to $542,079, an increase of $190,794 due to costs incurred to develop the hybrid-drive air-cooled chiller, which included a $96,172 increase in payroll cost and a $92,270 increase in outside development costs.
Gains on the sale of assets was $41,931 in 2022 compared to a gain on the sale of assets of $10,486 in 2021.
Impairment of long-lived assets decreased $2,726 to $4,674 in the year ended December 31, 2022 compared to $7,400 in 2021.
Loss from Operations
Loss from operations for the year ended December 31, 2022 was $2,349,141 compared to a loss of $1,219,092 in 2021, an increase in the loss from operations of $1,130,049. The increase in the net loss from operations is primarily due to a $520,842 decrease in gross margin due to higher products material costs and a $609,207 increase in operating expenses.
Other Income (Expense), net
Other expense, net, for the year ended December 31, 2022 was $32,219 compared to income of $4,979,600 for the same period in 2021, a decrease of $5,011,819, due primarily to the gain on extinguishment of debt as a result of the Paycheck Protection Program Loan forgiveness and the recognition of the Employee Retention Credit in 2021. For the year ended December 31, 2022, other income (expense) includes interest and other expense of $34,713 and net interest expense of $16,255, which is partially offset by unrealized income on marketable securities of $18,749. For the same period in 2021, other income, net interest and other expense included Paycheck Protection Program Loan forgiveness of $3,773,014, Employee Retention Credits of $1,276,021, partially offset by other expense of $23,746, interest expense of $14,238 and the unrealized loss on securities of $37,497, which represents the market value fluctuation of marketable equity securities as discussed in Note 15. "Fair value measurements".
Provision for State Income Taxes
The provision for state income taxes for the years ended December 31, 2022 and 2021 was $16,352 and $19,491, respectively, and represents estimated income tax payments, net of refunds, to various states.
Noncontrolling Interest
With the addition of American DG Energy, we have income and losses attributable to the noncontrolling interest we have in American DG Energy's 51% owned subsidiary, ADGNY, LLC. The noncontrolling interest share of ADGNY profits and losses was income of $50,215 for the year ended December 31, 2022 and income of $45,017 in 2021.
Net Income (Loss) Attributable to Tecogen Inc
Net loss for the year ended December 31, 2022 was $2,447,927 compared to a net income of $3,696,000 for the comparable period in 2021. The decrease in net income in 2022 was primarily due to the Paycheck Protection Program loan forgiveness and Employee Retention Credit contributing $3,773,014 and $1,276,021, respectively, in 2021 and was further impacted by the reduction in gross margin and the increase in operating expenses in 2022.
Net Income (Loss) Per Share
Net income per share for the year ended December 31, 2022 was a loss of $0.10 compared to income of $0.15 per share for the same period in 2021. The basic and diluted weighted average shares outstanding for the year ended December 31, 2022 were 24,850,261 and 24,850,261, respectively. For the year ended December 31, 2021, basic and diluted shares were 24,850,261 and 25,115,518, respectively.
Liquidity and Capital Resources
The following table presents a summary of our net cash flows from operating, investing, and financing activities:
| | | | | | | | | | | | | | |
| | Years End |
| Cash Provided by (Used in) | | December 31, 2022 | | December 31, 2021 |
| Operating activities | | $ | (1,351,929) | | | $ | 465,033 | |
| Investing activities | | (348,565) | | | (215,058) | |
| Financing activities | | — | | | 1,874,269 | |
| Change in cash and cash equivalents | | $ | (1,700,494) | | | $ | 2,124,244 | |
Consolidated working capital at December 31, 2022 was $14,344,288, compared to $16,193,881 at December 31, 2021, a decrease of $1,849,593 or 11.4%. Included in working capital were cash and cash equivalents of $1,913,969 at December 31, 2022, compared to $3,614,463 at December 31, 2021, a decrease of $1,700,494 or 47.0%. The decrease in consolidated working capital is primarily due to the second draw Paycheck Protection Program loan forgiveness and positive cash flow from operations in 2021.
For the year ended December 31, 2022 we used $1,351,929 in cash from operations compared to generating $465,033 in cash from operations in 2021, a decrease of $1,816,962 in net cash provided by operating activities. Our accounts receivable balance decreased by $2,401,904 at December 31, 2022 compared to December 31, 2021. Unbilled revenues also decreased by $1,452,860 in connection with turnkey projects as some revenues are recognized prior to contractual milestones for invoicing. Our inventory increased by $2,824,740 as of December 31, 2022 compared to December 31, 2021 and other non-current assets decreased by $625,320 as of December 31, 2022 as compared to December 31, 2021.
Accounts payable decreased by $246,401 from December 31, 2021 to December 31, 2022. Accrued expenses from operations decreased by $109,282 as of December 31, 2022 compared to December 31, 2021 due to lower operating expenses. Deferred revenues decreased by $678,758 as of December 31, 2022 as compared to December 31, 2021.
During 2022, our cash flows used by investing activities were $348,565, and included purchases of property and equipment of $314,879, distributions to non-controlling interests of $76,836, and capital outlays related to intangible assets such as patents and product certification of $29,505.
During 2021, our cash flows from financing activities were $1,874,269, consisting of the receipt of proceeds from the Second Draw Paycheck Protection Program loan.
Our total product and installation backlog as of December 31, 2022 was $6,722,138 million compared to $11,321,043 as of December 31, 2021. Backlog does not include maintenance contract service revenues or energy contract revenues.
At December 31, 2022 and 2021, we had cash and cash equivalents of $1,913,969 and $3,614,463, a decrease of $1,700,494 or 47.0%. During the year ended December 31, 2022, our revenues were negatively impacted due to customer order delays or deferrals; service delays due to customer facility closures, in some cases for extended periods and a reduction in our energy production revenues, due to business closures and increased remote work and learning environments. The extent to which the coronavirus pandemic will continue to impact our business, our financial results and our cash flows will depend on future developments, which are highly uncertain and cannot be predicted.
Based on our current operating plan, we believe existing resources, including cash and cash flows from operations will be sufficient to meet our working capital requirements for the next twelve months. In order to grow our business and fund the development of our hydrid-drive air-cooled chiller and the relocation of our primary facility, we expect that our cash requirements will increase and we may need to raise additional capital through a debt or equity financing to meet our need for capital to fund operations and future growth.
Contractual Obligations and Commitments
We are obligated under operating leases for our Waltham, Massachusetts headquarters through March 31, 2024, and our eleven leased service centers through January 2031. Future minimum lease commitments under non-cancellable operating leases as of December 31, 2022 were $1,311,041. See Note 13. "Leases.”
Seasonality
We expect that the majority of our heating systems sales will be operational for the winter and the majority of our chilling systems sales will be operational for the summer. Our cogeneration sales are not generally affected by the seasons. Our service team does experience higher demand in the warmer months when cooling is required. Chiller units for space conditioning applications are generally shut down in the winter and started up again in the spring. This chiller “busy season” for the service team generally runs from May through the end of September. Chillers in indoor cultivation and other process cooling applications run year round.
Item 7A. Quantitative and Qualitative Disclosures About Market Risk.
Disclosure in response to this item is not required of a smaller reporting company.
Item 8. Financial Statements and Supplementary Data.
The information required by this item is incorporated from Item 15 and pages F-1 through F-25 of this Annual Report on Form 10-K.
Item 9. Changes in and Disagreements with Accountants on Accounting and Financial Disclosure.
None.
Item 9A. Controls and Procedures.
Management’s Evaluation of Disclosure Controls and Procedures:
Our disclosure controls and procedures are designed to provide reasonable assurance that the control system’s objectives will be met. Our management, including our Chief Executive Officer and Principal Financial Officer, after evaluating the effectiveness of our disclosure controls and procedures as of December 31, 2022 ("Evaluation Date"), have concluded that as of the Evaluation Date, our disclosure controls and procedures were not effective due to the material weakness in financial reporting relating to a small number of employees dealing with general controls over information technology. Our management has decided that the expense associated with continued implementation of new systems is justified and continues to implement systems to put the proper control procedures in place to remediate this weakness.
For these purposes, the term disclosure controls and procedures of an issuer means controls and other procedures of an issuer that are designed to ensure that information required to be disclosed by the issuer in the reports that it files or submits under Section 13(a) or 15(d) of the Securities Exchange Act is recorded, processed, summarized and reported within the time periods specified in the SEC’s rules and forms. Disclosure controls and procedures include, without limitation, controls and procedures designed to ensure that information required to be disclosed by an issuer in the reports that it files or submits under Section 13(a) or 15(d) of the Securities Exchange Act is accumulated and communicated to the issuer’s management, including its principal executive and principal accounting officers, or persons performing similar functions, as appropriate to allow timely decisions regarding required disclosure.
Management’s Annual Report on Internal Control over Financial Reporting:
Our management is responsible for establishing and maintaining adequate internal controls over financial reporting as defined in Rules 13a-15(f) under the Securities Exchange Act of 1934, as amended.
Our internal control over financial reporting is a process designed to provide reasonable assurance regarding the reliability of financial reporting and the preparation of financial statements for external purposes in accordance with generally accepted accounting principles in the United States of America. Our internal controls over financial reporting include those policies and procedures that:
•pertain to the maintenance of records that in reasonable detail accurately and fairly reflect the transactions and dispositions of the assets of the Company;
•provide reasonable assurance that transactions are recorded as necessary to permit preparation of financial statements in accordance with U.S. generally accepted accounting principles;
•provide reasonable assurance that receipts and expenditures of the Company are being made only in accordance with authorizations of management and directors of the Company; and
•provide reasonable assurance regarding prevention or timely detection of unauthorized acquisition, use, or disposition of the Company’s assets that could have a material effect on the consolidated financial statements.
Because of its inherent limitations, internal control over financial reporting, no matter how well designed, may not prevent or detect misstatements. Accordingly, even effective internal control over financial reporting can provide only reasonable assurance with respect to financial statement preparation. Also, the assessment of the effectiveness of internal
control over financial reporting was made as of a specific date. Projections of any evaluation of effectiveness to future periods are subject to the risk that controls may become inadequate because of changes in conditions, or that the degree of compliance with the policies or procedures may deteriorate.
Management, including our Chief Executive Officer and Principal Financial Officer, conducted an evaluation of our internal control over financial reporting based on the framework and criteria established in Internal Control—Integrated Framework, issued by the Committee of Sponsoring Organizations of the Treadway Commission. This evaluation included review of the documentation of controls, evaluation of the design effectiveness of controls, testing of the operating effectiveness of controls and a conclusion regarding this evaluation. Based on this evaluation, management concluded that our internal control over financial reporting was not effective as of December 31, 2022.
At December 31, 2022, we employed 85 active full-time employees and 1 part-time employees. Due to the small number of employees dealing with general controls over information technology security and user access, management believes this constitutes a material weakness in financial reporting.
Our management, including our Chief Executive Officer and Principal Financial Officer, does not expect that our disclosure controls or our internal control over financial reporting will prevent or detect all errors and all fraud. A control system, no matter how well designed and operated, can provide only reasonable, not absolute, assurance that the control system’s objectives will be met. The design of a control system must reflect the fact that there are resource constraints, and the benefits of controls must be considered relative to their costs. Further, because of the inherent limitations in all control systems, no evaluation of controls can provide absolute assurance that misstatements due to error or fraud will not occur or that all control issues and instances of fraud, if any, within the Company have been detected. These inherent limitations include the realities that judgments in decision-making can be faulty and that breakdowns can occur because of a simple error or mistake. Controls can also be circumvented by the individual acts of some persons, by collusion of two or more people, or by management override of the controls. The design of any system of controls is based in part on certain assumptions about the likelihood of future events, and there can be no assurance that any design will succeed in achieving its stated goals under all potential future conditions. Projections of any evaluation of controls effectiveness to future periods are subject to risks. Over time, controls may become inadequate because of changes in conditions or deterioration in the degree of compliance with policies or procedures.
This annual report does not include an attestation report of our registered independent public accounting firm regarding internal control over financial reporting. Management’s report was not subject to attestation by our registered independent public accounting firm pursuant to rules of the Securities and Exchange Commission that permit us to provide only management’s report in this Annual Report on Form 10-K.
Changes in Internal Control Over Financial Reporting
We implemented a company-wide ERP system in 2019. We continue to make progress in remediating internal control weaknesses. There has been no change to our internal control over financial reporting (as such term is defined in Rules 13a-15(f) and 15d-15(f) under the Securities Exchange Act) during the fourth quarter of the fiscal year ended December 31, 2022 that has materially affected, or is reasonably likely to materially affect, our internal control over financial reporting.
Item 9B. Other Information.
None.
Item 9C. Disclosure Regarding Foreign Jurisdictions that Prevent Inspection.
Not applicable.
PART III
Item 10. Directors, Executive Officers and Corporate Governance.
The information required by this Item is incorporated by reference to our 2023 definitive proxy statement to be filed with the SEC within 120 days following the registrant's fiscal year ended December 31, 2022.
Item 11. Executive Compensation.
The information required by this Item is incorporated by reference to our 2023 definitive proxy statement to be filed with the SEC within 120 days following the registrant's fiscal year ended December 31, 2022.
Item 12. Security Ownership of Certain Beneficial Owners and Management and Related Stockholder Matters.
The information required by this Item is incorporated by reference to our 2023 definitive proxy statement to be filed with the SEC within 120 days following the registrant's fiscal year ended December 31, 2022.
Item 13. Certain Relationships and Related Transactions, and Director Independence.
The information required by this Item is incorporated by reference to our 2023 definitive proxy statement to be filed with the SEC within 120 days following the registrant's fiscal year ended December 31, 2022.
Item 14. Principal Accountant Fees and Services.
The information required by this Item is incorporated by reference to our 2023 definitive proxy statement to be filed with the SEC within 120 days following the registrant's fiscal year ended December 31, 2022.
PART IV
Item 15. Exhibits and Financial Statement Schedules.
The following are filed as part of this Annual Report on Form 10-K.
(a) Index to Financial Statements and Financial Statement Schedules
Report of Independent Registered Public Accounting Firm
Consolidated Balance Sheets as of December 31, 2022 and 2021
Consolidated Statements of Operations for the years ended December 31, 2022 and 2021
Consolidated Statements of Stockholders' Equity for the years ended December 31, 2022 and 2021
Consolidated Statements of Cash Flows for the years ended December 31, 2022 and 2021
Notes to Audited Consolidated Financial Statements
All other schedules for which provision is made in the applicable accounting regulations of the SEC are not required under the related instructions, or are inapplicable, and therefore have been omitted.
(b) Exhibits
The exhibits are listed in the Exhibit Index attached hereto and incorporated by reference herein.
Item 16. Form 10-K Summary.
The Company has determined not to include a summary of the information permitted by Item 16 of the Form 10-K.
EXHIBIT INDEX
| | | | | | | | |
| Exhibit Number | Description |
| 2.1 | |
| 2.2 | |
| 3.1 | |
| 3.2 | |
| 10.1 | |
| 10.2+ | |
| 10.3 | |
| 10.4 | |
| 10.5 | |
| 10.6 | |
| 10.7 | |
| 10.8+ | |
| 10.9 | |
| 10.10 | |
| 10.11# | |
| 10.12 | |
| 10.13 | |
| 10.14 | |
| 10.15+ | |
| 10.16 | |
| | | | | | | | |
| 10.17 | |
| 10.18 | |
| 10.19 | |
| 10.20 | |
| 10.21 | |
| 10.22 | |
| 10.23 | |
| 10.24 | |
| 10.25+ | |
| 10.26 | |
| 10.27 | |
| 10.28+ | |
| 10.29 | |
| 10.30 | |
| 21.1 | |
| 23.1* | |
| 24.1* | Power of Attorney (included on Signature pages of this Annual Report on Form 10-K) |
| 31.1* | |
| 32.1* | |
| 101.INS* | XBRL Instance Document |
| 101.SCH* | XBRL Taxonomy Extension Schema |
| 101.CAL* | XBRL Taxonomy Extension Calculation Linkbase |
| 101.DEF* | XBRL Taxonomy Extension Definition Linkbase |
| 101.LAB* | XBRL Taxonomy Extension Label Linkbase |
| 101.PRE* | XBRL Taxonomy Extension Presentation Linkbase |
| |
| * | Filed herewith. |
| |
| | | | | | | | |
| # | Confidential Treatment has been granted for portions of this document. The confidential portions were omitted and filed separately, on a confidential basis, with the Securities and Exchange Commission. |
| + | Management contract or compensatory plan or agreement. |
SIGNATURES
Pursuant to the requirements of Section 13 or 15(d) of the Securities Exchange Act of 1934, the registrant has duly caused this report to be signed on its behalf by the undersigned, thereunto duly authorized.
| | | | | | | | |
| | TECOGEN INC. |
| | (Registrant) |
| | |
| Dated: March 23, 2023 | By: | /s/ Abinand Rangesh |
| Chief Executive and Financial Officer |
| (Principal Executive and Financial Officer) |
KNOW ALL PERSONS BY THESE PRESENTS, that each person whose signature appears below constitutes and appoints Abinand Rangesh, with the power of substitution and re-substitution, as his or her attorney-in-fact and agent, for him or her and in his or her name, place and stead, in any and all capacities, to sign any and all amendments to this Annual Report on Form 10-K for the year ended December 31, 2022, and to file the same, with all exhibits thereto and other documents in connection therewith, with the Securities and Exchange Commission, granting unto said attorney-in-fact and agent, and each of them, full power and authority to do and perform each and every act and thing requisite and necessary to be done in connection therewith, as fully to all intents and purposes as he or she might or could do in person, hereby ratifying and confirming that said attorney-in-fact and agent, or his or her substitute or substitutes, may lawfully do or cause to be done by virtue hereof.
Pursuant to the requirements of the Securities Exchange Act of 1934, this report has been signed below by the following persons on behalf of the registrant and in the capacities and on the dates indicated.
| | | | | | | | | | | | | | |
| Signature | | Title | | Date |
| | | | | |
| /s/ Angelina M. Galiteva | | Director, Chairperson of the Board | | March 23, 2023 |
| Angelina M. Galiteva | | | | |
| | | | | |
| /s/ John N. Hatsopoulos | | Lead Director | | March 23, 2023 |
| John N. Hatsopoulos | | | | |
| | | | |
| /s/ Abinand Rangesh | | Director and Chief Executive and Financial Officer | | March 23, 2023 |
| Abinand Rangesh | | (Principal Executive and Financial Officer) | | |
| | | | | |
| /s/ Ahmed F. Ghoniem | | Director | | March 23, 2023 |
| Ahmed F. Ghoniem | | | | |
| | | | | |
| /s/ Earl R. Lewis III | | Director | | March 23, 2023 |
| Earl R. Lewis III | | | | |
| | | | |
| /s/ Fred Holubow | | Director | | March 23, 2023 |
| Fred Holubow | | | | |
| | | | |
| /s/ John M. Albertine | | Director | | March 23, 2023 |
| John M. Albertine | | | | |
Contents
Report of Independent Registered Public Accounting Firm F-2 Consolidated Financial Statements:
Consolidated balance sheets F-4 Consolidated statements of operations F-5 Consolidated statements of stockholders' equity F-6 Consolidated statements of cash flows F-7 Notes to the consolidated financial statements F-9
Report of Independent Registered Public Accounting Firm
To the Board of Directors and Stockholders of Tecogen Inc.
Opinion on the Financial Statements
We have audited the accompanying consolidated balance sheets of Tecogen Inc. (the “Company”) as of December 31, 2022 and 2021, the related consolidated statements of operations, stockholders' equity, and cash flows, for the years then ended, and the related notes (collectively referred to as the "financial statements"). In our opinion, the financial statements present fairly, in all material respects, the financial position of the Company as of December 31, 2022 and 2021, and the results of its operations and its cash flows for the years then ended, in conformity with accounting principles generally accepted in the United States of America.
Basis for Opinion
These financial statements are the responsibility of the Company's management. Our responsibility is to express an opinion on the Company's financial statements based on our audits. We are a public accounting firm registered with the Public Company Accounting Oversight Board (United States) ("PCAOB") and are required to be independent with respect to the Company in accordance with the U.S. federal securities laws and the applicable rules and regulations of the Securities and Exchange Commission and the PCAOB.
We conducted our audits in accordance with the standards of the PCAOB. Those standards require that we plan and perform the audit to obtain reasonable assurance about whether the financial statements are free of material misstatement, whether due to error or fraud. The Company is not required to have, nor were we engaged to perform, an audit of its internal control over financial reporting. As part of our audits we are required to obtain an understanding of internal control over financial reporting, but not for the purpose of expressing an opinion on the effectiveness of the Company’s internal control over financial reporting. Accordingly, we express no such opinion.
Our audits included performing procedures to assess the risks of material misstatement of the financial statements, whether due to error or fraud, and performing procedures that respond to those risks. Such procedures included examining, on a test basis, evidence regarding the amounts and disclosures in the financial statements. Our audits also included evaluating the accounting principles used and significant estimates made by management, as well as evaluating the overall presentation of the financial statements. We believe that our audits provide a reasonable basis for our opinion.
Critical Audit Matters
Critical audit matters are matters arising from the current period audit of the financial statements that were communicated or required to be communicated to the audit committee and that: (1) relate to accounts or disclosures that are material to the financial statements and (2) involved our especially challenging, subjective, or complex judgments.
We have determined that there are no critical audit matters in the current period.
/s/ WOLF & COMPANY, P.C.
PCAOB ID 392
We have served as the Company's auditor since 2014.
Boston, Massachusetts
March 23, 2023
CONSOLIDATED BALANCE SHEETS
As of December 31, 2022 and 2021 | | | | | | | | | | | |
| ASSETS | 2022 | | 2021 |
| | | |
| Current assets: | | | |
| Cash and cash equivalents | $ | 1,913,969 | | | $ | 3,614,463 | |
| Accounts receivable, net | 6,714,122 | | | 8,482,286 | |
| Employee retention credit receivable | 713,269 | | | 1,276,021 | |
| Unbilled revenue | 1,805,330 | | | 3,258,189 | |
| Inventory, net | 10,482,729 | | | 7,764,989 | |
| | | |
| | | |
| | | |
| Prepaid and other current assets | 401,189 | | | 578,801 | |
| Total current assets | 22,030,608 | | | 24,974,749 | |
| Property, plant and equipment, net | 1,407,720 | | | 1,782,944 | |
| Right of use assets | 1,245,549 | | | 1,869,210 | |
| | | |
| Intangible assets, net | 997,594 | | | 1,181,023 | |
| | | |
| Goodwill | 2,406,156 | | | 2,406,156 | |
| Other assets | 165,230 | | | 148,140 | |
| TOTAL ASSETS | $ | 28,252,857 | | | $ | 32,362,222 | |
| | | |
| LIABILITIES AND STOCKHOLDERS’ EQUITY | | | |
| Current liabilities: | | | |
| | | |
| | | |
| | | |
| Accounts payable | 3,261,952 | | | 3,508,354 | |
| Accrued expenses | 2,384,447 | | | 2,343,728 | |
| Deferred revenue | 1,115,627 | | | 1,957,752 | |
| Lease obligations | 687,589 | | | 641,002 | |
| Unfavorable contract liabilities | 236,705 | | | 330,032 | |
| | | |
| Total current liabilities | 7,686,320 | | | 8,780,868 | |
| | | |
| Long-term liabilities: | | | |
| Deferred revenue, net of current portion | 371,823 | | | 208,456 | |
| | | |
| Lease obligations, net of current portion | 623,452 | | | 1,315,275 | |
| Unfavorable contract liability, net of current portion | 583,512 | | | 929,474 | |
| Total liabilities | 9,265,107 | | | 11,234,073 | |
| | | |
| Commitments and contingencies (Note 11) | | | |
| | | |
| | | |
| Stockholders’ equity: | | | |
| | | |
Common stock, $0.001 par value; 100,000,000 shares authorized; 24,850,261 and 24,850,261 issued and outstanding at December 31, 2022 and 2021, respectively | 24,850 | | | 24,850 | |
| Additional paid-in capital | 57,351,008 | | | 57,016,859 | |
| | | |
| | | |
| Accumulated deficit | (38,281,548) | | | (35,833,621) | |
| Total Tecogen Inc. stockholders’ equity | 19,094,310 | | | 21,208,088 | |
| Noncontrolling interest | (106,560) | | | (79,939) | |
| Total stockholders’ equity | 18,987,750 | | | 21,128,149 | |
| TOTAL LIABILITIES AND STOCKHOLDERS’ EQUITY | $ | 28,252,857 | | | $ | 32,362,222 | |
The accompanying notes are an integral part of these consolidated financial statements.
CONSOLIDATED STATEMENTS OF OPERATIONS
For the Years Ended December 31, 2022 and 2021
| | | | | | | | | | | |
| | 2022 | | 2021 |
| Revenues | | | |
| Products | $ | 11,156,099 | | $ | 10,133,329 |
| Services | 12,060,661 | | 12,525,594 |
| Energy production | 1,785,854 | | 1,739,150 |
| Total revenues | 25,002,614 | | 24,398,073 |
| Cost of sales | | | |
| Products | 7,413,320 | | 5,601,046 |
| Services | 5,525,493 | | 6,134,953 |
| Energy production | 996,990 | | 1,074,421 |
| Total cost of sales | 13,935,803 | | 12,810,420 |
| | | |
| Gross profit | 11,066,811 | | 11,587,653 |
| | | |
| Operating expenses | | | |
| General and administrative | 10,909,251 | | 9,795,823 |
| Selling | 1,811,085 | | 2,471,929 |
| Research and development | 732,873 | | 542,079 |
| Gain on sale of assets | (41,931) | | (10,486) |
| Long-lived asset impairment | 4,674 | | 7,400 |
| | | |
| | | |
| Total operating expenses | 13,415,952 | | 12,806,745 |
| | | |
| Loss from operations | (2,349,141) | | (1,219,092) |
| | | |
| Other income (expense) | | | |
| Interest and other income (expense) | (34,713) | | (23,746) |
| Interest expense | (16,255) | | (14,238) |
| Gain on extinguishment of debt | — | | | 3,773,014 |
| Employee Retention Credit | — | | | 1,276,021 |
| Gain on the sale of investments | — | | | 6,046 |
| Unrealized gain (loss) on investment securities | 18,749 | | (37,497) |
| Total other income (expense), net | (32,219) | | 4,979,600 |
| | | |
| Income (loss) before income taxes | (2,381,360) | | 3,760,508 |
| | | |
| State income tax provision | 16,352 | | 19,491 |
| Consolidated net income (loss) | (2,397,712) | | 3,741,017 |
| | | |
| Income attributable to the noncontrolling interest | (50,215) | | (45,017) |
| Net income (loss) attributable to Tecogen Inc. | $ | (2,447,927) | | $ | 3,696,000 |
| | | |
| Net income (loss) per share - basic | $ | (0.10) | | | $ | 0.15 | |
| Weighted average shares outstanding - basic | 24,850,261 | | 24,850,261 |
| Net income (loss) per share - diluted | $ | (0.10) | | | $ | 0.15 | |
| Weighted average shares outstanding -diluted | 24,850,261 | | 25,115,518 |
| | | |
The accompanying notes are an integral part of these consolidated financial statements.
CONSOLIDATED STATEMENTS OF STOCKHOLDERS’ EQUITY
For the Years Ended December 31, 2022 and 2021
| | | | | | | | | | | | | | | | | | | | | | | | | | | | | | | | | | | | | | | | | |
| | | | | | |
| | Common Stock Shares | | Common Stock $.001 Par Value | | Additional
Paid-In
Capital | | | | Accumulated
Deficit | | Non-controlling
Interest | | | Total |
| Balance at December 31, 2020 | | 24,850,261 | | | $ | 24,850 | | | $ | 56,814,428 | | | | | $ | (39,529,621) | | | $ | (42,323) | | | | $ | 17,267,334 | |
| Distributions to noncontrolling interest | | — | | | — | | | — | | | | | — | | | (82,633) | | | | (82,633) | |
| Stock-based compensation | | — | | | — | | | 202,431 | | | | | — | | | — | | | | 202,431 | |
| Net income | | — | | | — | | | — | | | | | 3,696,000 | | | 45,017 | | | | 3,741,017 | |
| Balance at December 31, 2021 | | 24,850,261 | | | 24,850 | | | 57,016,859 | | | | | (35,833,621) | | | (79,939) | | | | 21,128,149 | |
| Distributions to noncontrolling interest | | — | | | — | | | — | | | | | — | | | (76,836) | | | | (76,836) | |
| Stock-based compensation | | — | | | — | | | 334,149 | | | | | — | | | — | | | | 334,149 | |
| Net income (loss) | | — | | | — | | | — | | | | | (2,447,927) | | | 50,215 | | | | (2,397,712) | |
| Balance at December 31, 2022 | | 24,850,261 | | | $ | 24,850 | | | $ | 57,351,008 | | | | | $ | (38,281,548) | | | $ | (106,560) | | | | $ | 18,987,750 | |
| | | | | | | | | | | | | | | |
The accompanying notes are an integral part of these consolidated financial statements.
CONSOLIDATED STATEMENTS OF CASH FLOWS
For the Years Ended December 31, 2022 and 2021 | | | | | | | | | | | |
| 2022 | | 2021 |
|
| CASH FLOWS FROM OPERATING ACTIVITIES: | | | |
| Consolidated net income (loss) | $ | (2,397,712) | | | $ | 3,741,017 | |
| Adjustments to reconcile net income (loss) to net cash (used in) provided by operating activities: | | | |
| Depreciation, accretion and amortization, net | 428,348 | | | 469,854 | |
| Gain on the extinguishment of debt | — | | | (3,773,014) | |
| Employee retention credit | — | | | (1,276,021) | |
| Long-lived asset impairment | 4,674 | | | 7,400 | |
| Gain on sale of assets | (41,931) | | | (10,486) | |
| Provision for doubtful accounts receivable | (70,987) | | | 131,206 | |
| Gain on the sale of investments | — | | | (6,046) | |
| Provision for litigation | 150,000 | | | — | |
| Provision for inventory reserve | 107,000 | | | — | |
| Unrealized (gain) loss on investment securities | (18,749) | | | 37,497 | |
| Stock-based compensation | 334,149 | | | 202,431 | |
| | | |
| | | |
| Changes in operating assets and liabilities: | | | |
| (Increase) decrease in: | | | |
| Accounts receivable | 2,401,904 | | | 57,618 | |
| Inventory, net | (2,824,740) | | | (596,393) | |
| Unbilled revenue | 1,452,860 | | | 1,009,060 | |
| Prepaid expenses and other current assets | 177,612 | | | 18,343 | |
| Other non-current assets | 625,320 | | | (231,478) | |
| Increase (decrease) in: | | | |
| Accounts payable | (246,401) | | | (674,750) | |
| Accrued expenses | (109,282) | | | 374,802 | |
| Deferred revenue | (678,758) | | | 756,722 | |
| Other current liabilities | (645,236) | | | 227,271 | |
| Net cash (used in) provided by operating activities | (1,351,929) | | | 465,033 | |
| CASH FLOWS FROM INVESTING ACTIVITIES: | | | |
| Purchases of property and equipment | (314,879) | | | (91,451) | |
| Proceeds on sale of property and equipment | 72,655 | | | 10,486 | |
| Purchases of intangible assets | (29,505) | | | (63,097) | |
| Proceeds from sale of investments | — | | | 11,637 | |
| Distributions to noncontrolling interest | (76,836) | | | (82,633) | |
| Net used in investing activities | (348,565) | | | (215,058) | |
| CASH FLOWS FROM FINANCING ACTIVITIES: | | | |
| | | |
| Proceeds from note payable | — | | | 1,874,269 | |
| | | |
| | | |
| | | |
| | | |
| | | |
| | | |
| | | |
| | | |
| | | |
| | | |
| | | |
| Net cash provided by financing activities | — | | | 1,874,269 | |
| Change in cash and cash equivalents | (1,700,494) | | | 2,124,244 | |
| Cash and cash equivalents, beginning of the year | 3,614,463 | | | 1,490,219 | |
| Cash and cash equivalents, end of the year | $ | 1,913,969 | | | $ | 3,614,463 | |
Supplemental disclosure of cash flow information:
| | | | | | | | | | | |
| Cash paid for interest | $ | 14,597 | | | $ | 241 | |
| Cash paid for taxes | $ | 16,352 | | | $ | 19,491 | |
| | | |
| | | |
| | | |
| | | |
| | | |
| | | |
| | | |
| | | |
| | | |
| | | |
| | | |
The accompanying notes are an integral part of these consolidated financial statements.
TECOGEN INC.
Notes to Audited Consolidated Financial Statements for December 31, 2022 and 2021
Note 1 – Nature of business and operations
Tecogen Inc. (together with its subsidiaries "we", "our", "us" or "Tecogen"), a Delaware Corporation, was incorporated on September 15, 2000, and acquired the assets and liabilities of the Tecogen Products division of Thermo Power Corporation. We produce commercial and industrial, natural-gas-fueled engine-driven, combined heat and power (CHP) products that reduce energy costs, decrease greenhouse gas emissions and alleviate congestion on the national power grid. Our products supply electric power or mechanical power for cooling, while heat from the engine is recovered and purposefully used at a facility. The majority of our customers are located in regions with the highest utility rates, typically California, the Midwest and the Northeast.
Our operations are comprised of three business segments. Our Products segment designs, manufactures and sells industrial and commercial cogeneration systems as described above. Our Services segment provides operation and maintenance services to customers for our products. Our Energy Production segment sells energy in the form of electricity, heat, hot water and cooling to our customers under long-term sales agreements.
Note 2 – Summary of significant accounting policies
Principles of Consolidation and Basis of Presentation
The financial statements have been prepared in accordance with accounting standards set by the Financial Accounting Standards Board, or FASB. The FASB sets generally accepted accounting principles, or GAAP, to ensure financial condition, results of operations, and cash flows are consistently reported. References to GAAP issued by the FASB in these footnotes are to the FASB Accounting Standards Codification, or ASC. We adopted the presentation requirements for noncontrolling interests required by ASC 810 Consolidation. Under ASC 810, earnings or losses attributed to the noncontrolling interests are reported as part of the consolidated earnings and not a separate component of income or expense.
The accompanying consolidated financial statements include our accounts and the accounts of the entities in which we have a controlling financial interest. Those entities include our wholly-owned subsidiary, American DG Energy Inc. ("ADGE"), Tecogen CHP Solutions, Inc., and a joint venture, American DG New York, LLC, or ADGNY, in which ADGE holds a 51.0% interest. As the controlling partner, all major decisions in respect of ADGNY are made by ADGE in accordance with the joint venture agreement. The interests in the individual underlying energy system projects in ADGNY vary between ADGE and its joint venture partner. The noncontrolling interest and distributions are determined based on economic ownership. The economic ownership is calculated by the amount invested by us and the noncontrolling partner in each site. Each quarter, we calculate a year-to-date profit/loss for each site that is part of ADGNY and the noncontrolling interest percent of economic ownership in each site is applied to determine the noncontrolling interest share in the profit/loss. The same methodology is used to determine quarterly distributions of available cash to the noncontrolling interest partner. On our balance sheet, noncontrolling interest represents the joint venture partner’s investment in ADGNY, plus its share of after-tax profits less any cash distributions. ADGE owned a controlling 51.0% legal and economic interest in ADGNY as of December 31, 2022.
Investments in partnerships and companies in which we do not have a controlling financial interest but where we have significant influence, if any, are accounted for under the equity method.
Noncontrolling interests in the net assets and operations of ADGNY are reflected in the caption “Noncontrolling interest” in the accompanying consolidated financial statements. All intercompany transactions have been eliminated.
Use of Estimates
The preparation of financial statements in conformity with accounting principles generally accepted in the United States of America requires management to make estimates and assumptions that affect the reported amounts of assets and liabilities and disclosure of contingent assets and liabilities at the date of the financial statements and the reported amounts of revenues and expenses during the reporting period. Actual results could differ from those estimates.
Employee Retention Credit
On March 27, 2020, the Coronavirus Aid, Relief, and Economic Security Act (“CARES Act”) was signed into law providing numerous tax provisions and other stimulus measures, including an employee retention credit (“ERC”), which is a refundable tax credit against certain employment taxes. The Taxpayer Certainty and Disaster Tax Relief Act of 2020 and the American Rescue Plan Act of 2021 extended and expanded the availability of the ERC.
TECOGEN INC.
Notes to Audited Consolidated Financial Statements for December 31, 2022 and 2021
Section 2301(c)(2)(B) of the CARES Act permits an employer to use an alternative quarter to calculate gross receipts and the employer may determine if the decline in gross receipt tests is met for a calendar quarter in 2021 by comparing its gross receipts for the immediately preceding calendar quarter with those for the corresponding calendar quarter in 2019. Accordingly, for the first quarter of 2021, we elected to use our gross receipts for the fourth calendar quarter of 2020 compared to our gross receipts for the fourth calendar quarter of 2019. As a result of our election to use an alternative quarter, we qualified for the ERC in the first, second and third quarters of 2021 because our gross receipts decreased by more than 20% from the first, second and third quarters of 2019. As a result of averaging 100 or fewer full-time employees in 2019, all wages paid to employees in the first, second and third quarters of 2021, excluding the wages that were applied to the Paycheck Protection Loan Second Draw, were eligible for the ERC. Wages used towards PPP loan forgiveness cannot be used as qualified wages for purposes of the ERC.
Accounting Standards Codification 105, "Generally Accepted Accounting Principles," describes the decision-making framework when no guidance exists in US GAAP for a particular transaction. Specifically, ASC 105-10-05-2 instructs companies to look for guidance for a similar transaction within US GAAP and apply that guidance by analogy. As such, forms of government assistance, such as the ERC, provided to business entities would not be within the scope of ASC 958, but it may be applied by analogy under ASC 105-10-05-2. We accounted for the Employee Retention Credit as a government grant in accordance with Accounting Standards Update 2013-06, Not-for-Profit Entities (Topic 958) ("ASU 2013-06") by analogy under ASC 105-10-05-2. Under this standard, government grants are recognized when the conditions on which they depend are substantially met. The conditions for recognition of the ERC include, but are not limited to:
•An entity has been adversely affected by the COVID-19 pandemic;
•We have not used qualifying payroll for both the Paycheck Protection Program and the ERC;
•We incurred payroll costs to retain employees; and,
•The process for filing for the credit is an administrative task and not a barrier to receiving the credits.
During the three months ended June 30, 2021, we recorded an ERC benefit for the first and second quarters of 2021 of $713,269 and, in the three months ended September 30, 2021 we recorded an ERC benefit for the third quarter of 2021 of $562,752, respectively, in other income (expense), net in the our condensed consolidated statements of operations. A current receivable in the amount of $713,269 is included in our condensed consolidated balance sheet as of December 31, 2022. On April 14, 2022, we received $564,027 from the Internal Revenue Service representing the ERC claim for the third quarter of 2021 and $1,275 of accrued interest. We received $667,121 from the Internal Revenue Service on January 12, 2023 in payment of the ERC claimed from the first and second quarters of 2021 and $15,775 of accrued interest. We expect to receive the remaining balance of $46,148 in the second quarter of 2023.
Concentration of Credit Risk
Financial instruments that expose us to concentrations of credit risk consist primarily of cash and cash equivalents and accounts receivable. We maintain our cash balances in bank accounts, which at times may exceed the Federal Deposit Insurance Corporation’s general deposit insurance limits. The amount on deposit at December 31, 2022 and 2021 which exceeded the $250,000 federally insured limit were approximately $1,393,823 and $3,592,111, respectively. We have not experienced any losses in such accounts and thus believe that we are not exposed to any significant credit risk on cash.
There was one customer who represented 12% of revenues for the year ended December 31, 2022 and no customer who represented more than 10% of revenues for the year ended December 31, 2021. There was one customer who represented 15% of the accounts receivable balance as of December 31, 2022, and two customers who represented 14% and 12%, respectively, of the accounts receivable balance as of December 31, 2021.
Cash and Cash Equivalents
We consider all highly liquid instruments with an original maturity date of three months or less when purchased to be cash and cash equivalents. We have cash balances in certain financial institutions in amounts which occasionally exceed current federal deposit insurance limits. The financial stability of these institutions is continually reviewed by senior management. We believe that we are not exposed to any significant credit risk on cash and cash equivalents.
Accounts Receivable
Accounts receivable are stated at the amount management expects to collect from outstanding balances. An allowance for doubtful accounts is provided for those accounts receivable considered to be uncollectible based upon historical experience and management’s evaluation of outstanding accounts receivable at the end of the year. Bad debts are written off against the allowance when identified. At December 31, 2022 and 2021, the allowance for doubtful accounts was $361,197 and $549,206, respectively.
TECOGEN INC.
Notes to Audited Consolidated Financial Statements for December 31, 2022 and 2021
Inventory
Raw materials, work in process, and finished goods inventories are stated at the lower of cost, as determined by the average cost method, or net realizable value. We periodically review inventory quantities on hand for excess and/or obsolete inventory based primarily on historical usage, as well as based on estimated forecast of product demand. Any reserves that result from this review are charged to cost of sales.
Property, Plant and Equipment
Property, plant and equipment are recorded at cost. Depreciation is provided using the straight-line method over the estimated useful life of the asset, which range from three to fifteen years. Leasehold improvements are amortized using the straight-line method over the lesser of the estimated useful lives of the assets or the term of the related leases. Expenditures for maintenance and repairs are expensed currently, while renewals and betterments that materially extend the life of an asset are capitalized.
We review our property, plant and equipment for potential impairment whenever events or changes in business circumstances indicate that the carrying value of the assets may not be fully recoverable or that the useful lives of the assets are no longer appropriate. We evaluate the recoverability of our long-lived assets when impairment is indicated by comparing the net book value of the asset group to the estimated future undiscounted cash flows attributable to such assets. f the sum of the projected undiscounted cash flows (excluding interest charges) is less than the carrying value of the assets, the assets will be written down to the estimated fair value and such loss is recognized in income from continuing operations in the period in which the determination is made. If impairment is indicated, the asset is written down to its estimated fair value.
Intangible Assets
Intangible assets subject to amortization include costs incurred by us to acquire product certifications, certain patent costs and developed technologies. These costs are amortized on a straight-line basis over the estimated economic life of the intangible asset. Indefinite life intangible assets such as trademarks are recorded at cost and not amortized.
The favorable contract asset which relates to existing ADGE customer contracts is more fully described in Note 7. "Intangible assets and liabilities other than goodwill".
Impairment of Long-lived Assets
Long-lived assets, including intangible assets and property, plant and equipment, are evaluated for impairment whenever events or changes in circumstances have indicated that an asset may not be recoverable and are grouped with other assets to the lowest level for which identifiable cash flows are largely independent of the cash flows of other groups of assets and liabilities. If the sum of the projected undiscounted cash flows (excluding interest charges) is less than the carrying value of the assets, the assets will be written down to the estimated fair value and such loss is recognized in income from continuing operations in the period in which the determination is made. Management determined that an impairment of $4,674 and $7,400 of long-lived assets existed as of December 31, 2022 and December 31, 2021, respectively.
For the years ended December 31, 2022 and December 31, 2021, we recorded impairment of long-lived assets as follows:
| | | | | | | | | | | |
| Years Ended | December 31, 2022 | | December 31, 2021 |
| | | |
| Energy production asset impairment (1) | $ | 156,655 | | | $ | — | |
| Energy production reversal of unfavorable contract liability (2) | (151,981) | | | — | |
| Patent applications abandonment | — | | | 7,400 | |
| Long-lived asset impairment | $ | 4,674 | | | $ | 7,400 | |
| | | |
| (1) - See Note 8."Property, plant and equipment" | |
| (2) - See Note 7."Intangible Assets and Liabilities Other Than Goodwill" |
Goodwill
Goodwill is the excess of the acquisition cost of businesses over the fair value of the identifiable net assets acquired.
Impairment testing for goodwill is performed annually, generally in the fourth fiscal quarter, or more frequently if impairment indicators are present.
To determine if goodwill is potentially impaired, we have the option to perform a qualitative assessment. However, we may elect to bypass the qualitative assessment and perform an impairment test even if no indications of a potential impairment
TECOGEN INC.
Notes to Audited Consolidated Financial Statements for December 31, 2022 and 2021
exist. The impairment test for goodwill is performed at the reporting unit level and compares the fair value of the reporting unit (calculated using a discounted cash flow method) to its carrying value, including goodwill. The discount rate represents our estimate of the weighted-average cost of capital, or expected return, that a marketplace participant would have required as of the valuation date. If the carrying value exceeds the fair value, an impairment charge is recorded for the excess carrying value over fair value, limited to the total amount of goodwill of that reporting unit. Our assessment in 2022 indicated that the carrying value of our energy production reporting unit did not exceed its fair value and therefore goodwill was not impaired. (see Note 9."Goodwill").
We early-adopted the provisions of ASU 2017-04, during 2018, which simplified the impairment testing process by eliminating the requirement to determine the implied fair value of goodwill. We test goodwill for impairment on either a qualitative basis under certain conditions, or a quantitative basis. On a quantitative basis, fair value of the reporting units is primarily determined using a probability weighted discounted cash flow analysis.
Leases
On January 1, 2019, we adopted the guidance under ASU No. 2016-02, “Leases” ("ASC 842”). ASC 842 requires lessees to recognize most leases on their balance sheets as a right-of-use ("ROU") asset with a corresponding lease liability. ROU assets represent our right to use an underlying asset for the lease term and lease liabilities represent our obligation to make lease payments arising from the lease. Lease ROU assets and liabilities are recognized at commencement date based on the present value of lease payments over the expected lease term. See Note 13."Leases".
Income (loss) per Common Share
We compute basic income (loss) per share by dividing net income (loss) for the period by the weighted-average number of shares of common stock outstanding during the period. We compute our diluted earnings per common share using the treasury stock method. For purposes of calculating diluted earnings per share, we consider our shares issuable in connection with the convertible debentures, stock options and warrants to be dilutive common stock equivalents when the exercise/conversion price is less than the average market price of our common stock for the period.
Segment Information
Our operations are comprised of three business segments. Our Products segment designs, manufactures and sells industrial and commercial cogeneration systems as described above. Our Services segment installs and maintains our cogeneration systems. Our Energy Production segment sells energy in the form of electricity, heat, hot water and cooling to our customers under long-term sales agreements.
Income Taxes
We use the asset and liability method of accounting for income taxes. The current or deferred tax consequences of transactions are measured by applying the provisions of enacted tax laws to determine the amount of taxes payable currently or in future years. Deferred tax assets and liabilities are determined based on the difference between the financial statement and tax bases of assets and liabilities and expected future tax consequences of events that have been included in the financial statements or tax returns using enacted tax rates in effect for the years in which the differences are expected to reverse. Under this method, a valuation allowance is used to offset deferred taxes if, based upon the available evidence, it is more likely than not that some or all of the deferred tax assets may not be realized. Management evaluates the recoverability of deferred taxes and the adequacy of the valuation allowance annually.
We have adopted the provisions of the accounting standards relative to accounting for uncertainties in tax positions. These provisions provide guidance on the recognition, derecognition and measurement of potential tax benefits associated with tax positions. We elected to recognize interest and penalties related to income tax matters as a component of income tax expense in the statements of operations. We have analyzed our current tax return compliance positions and determined that no uncertain tax positions have been taken that would require recognition.
With few exceptions, we are no longer subject to possible income tax examinations by federal, state or local taxing authorities for tax years before 2019, with the exception of loss carryforwards in the event they are utilized in future years. Our tax returns are open to adjustment from 2001 forward, as a result of the fact that the we have loss carryforwards from those years, which may be adjusted in the year those losses are utilized.
Fair Value of Financial Instruments
Our financial instruments are cash and cash equivalents, accounts receivable, available-for-sale securities and accounts payable. The recorded values of cash and cash equivalents, accounts receivable and accounts payable approximate their fair values based on their short-term nature. See Note 15. "Fair value measurements".
TECOGEN INC.
Notes to Audited Consolidated Financial Statements for December 31, 2022 and 2021
Revenue Recognition
Revenue is recognized when performance obligations under the terms of a contract with our customer are satisfied; generally, this occurs with the transfer of control of our products, services and energy production. Revenue is measured as the amount of consideration we expect to receive in exchange for transferring goods or providing services or energy to customers.
Shipping and handling fees billed to customers in a sales transaction are recorded in revenue and shipping and handling costs incurred are recorded in general and administrative expenses. For the years ended December 31, 2022 and 2021, $563,482 and $385,351 of shipping and handling costs were included in general and administrative expenses in the accompanying consolidated statements of operations, respectively. We elected to exclude from revenue any value-add sales and other taxes which we collect concurrent with revenue-producing activities. These accounting policy elections are consistent with the manner in which we have historically recorded shipping and handling fees and taxes. Incremental costs incurred by us in obtaining a contract with a customer are negligible, if any, and are expensed ratably in proportion to the related revenue recognized.
Disaggregated Revenue
In general, our business segmentation are aligned according to the nature and economic characteristics of our products and customer relationships and provides meaningful disaggregation of each business segment's results of operations.
The following table further disaggregates our revenue by major source by segment for the years ended December 31, 2022 and 2021.
| | | | | | | | | | | | | | | | | | | | | | | | | | |
| Year Ended | | December 31, 2022 |
| | Products | | Services | | Energy Production | | Total |
| Products | | $ | 11,156,099 | | | $ | — | | | $ | — | | | $ | 11,156,099 | |
| Installation services | | — | | | 257 | | | — | | | 257 | |
| Maintenance services | | — | | | 12,060,404 | | | — | | | 12,060,404 | |
| Energy production | | — | | | — | | | 1,785,854 | | | 1,785,854 | |
| Total revenue | | $ | 11,156,099 | | | $ | 12,060,661 | | | $ | 1,785,854 | | | $ | 25,002,614 | |
| | | | | | | | |
| | | | | | | | |
| Year Ended | | December 31, 2021 |
| | Products | | Services | | Energy Production | | Total |
| Products | | $ | 10,133,329 | | | $ | — | | | $ | — | | | $ | 10,133,329 | |
| Installation services | | — | | | 938,831 | | | — | | | 938,831 | |
| Maintenance services | | — | | | 11,586,763 | | | — | | | 11,586,763 | |
| Energy production | | — | | | — | | | 1,739,150 | | | 1,739,150 | |
| Total revenue | | $ | 10,133,329 | | | $ | 12,525,594 | | | $ | 1,739,150 | | | $ | 24,398,073 | |
Products Segment
Products. Our Product revenues include cogeneration systems that supply electricity and hot water, chillers that provide air-conditioning and hot water and engineered accessories, which consist of ancillary products and parts necessary to install a cogeneration unit including integration into the customers’ existing electrical and mechanical systems. Prior to January 1, 2021, engineered accessories revenue and cost of sales had been reported in our financial statements under Installation Services. Engineered accessories revenue and cost of sales from prior periods have been reclassified to conform with the current year presentation. We refer to the package of engineered accessories and engineering and design services necessary for the customers' installation of a cogeneration unit as light installation services.
We transfer control and generally recognize a sale when we ship a product from our manufacturing facility at which point the customer takes ownership of the product. Payment terms on product sales are generally 30 days.
We recognize revenue in certain circumstances before delivery to the customer has occurred (commonly referred to as bill and hold transactions). We recognize revenue related to such transactions once, among other things, the customer has made a written fixed commitment to purchase the product(s) under normal billing and credit terms, the customer has requested the product(s) be held for future delivery as scheduled and designated by them, risk of ownership has been assumed by the customer, and the product(s) are tagged as sold and segregated for storage awaiting further direction from the customer. Due to
TECOGEN INC.
Notes to Audited Consolidated Financial Statements for December 31, 2022 and 2021
the infrequent nature and duration of bill and hold arrangements, the value associated with custodial storage services is deemed immaterial in the context of the contract and in total, and accordingly, none of the transaction price is allocated to such service.
Depending on the product and terms of the arrangement, we may defer the recognition of a portion of the transaction price received because we have to satisfy a future obligation (e.g., product start-up service). Amounts allocated to product start-up services are recognized as revenue when the start-up service has been completed. We use an observable selling price to determine standalone selling prices where available and either a combination of an adjusted market assessment approach, an expected cost plus a margin approach, and/or a residual approach to determine the standalone selling prices for separate performance obligations as a basis for allocating contract consideration when an observable selling price is not available. Amounts received but not recognized pending completion of performance are recognized as contract liabilities and are recorded as deferred revenue along with deposits by customers.
Services Segment
Maintenance Services. Maintenance services are provided under either long-term maintenance contracts or time and material maintenance contracts. Revenue under time and material maintenance contracts is recognized when the maintenance service is completed. Revenue under long-term maintenance contracts is recognized either ratably over the term of the contract where the contract price is fixed or when the periodic maintenance activities are completed where the invoiced cost to the customer is based on run hours or kilowatts produced in a given period. We use an output method to measure progress towards completion of our performance obligation which results in the recognition of revenue on the basis of a direct measurement of the value to the customer of the services transferred to date relative to the remaining services promised under the contract. We use the practical expedient at ASC 606-10-55-18 of recognizing revenue in an amount equal to the amount we have the right to invoice the customer under the contract. Payment terms for maintenance services are generally 30 days.
Installation Services. We provide both complete turnkey installation services which typically include all necessary engineering and design, labor, subcontract labor to install a cogeneration unit including integration into the customers’ existing electrical and mechanical systems. Under complete turnkey installation service contracts revenue is recognized over time using the percentage-of-completion method determined on a cost to cost basis. Our performance obligation under such contracts are satisfied progressively over time as enhancements are made to customer owned and controlled properties. We measure progress towards satisfaction of the performance obligation based on an input method based on cost which we believe is the most faithful depiction of the transfer of products and services to the customer under these contracts. When the financial metrics of a contract indicate a loss, our policy is to record the entire expected loss as soon as it is known. Contract costs and profit recognized to date under the percentage-of-completion method in excess of billings are recognized as contract assets and are recorded as unbilled revenue. Billings in excess of contract costs and profit are recognized as contract liabilities and are recorded as deferred revenue. Generally billings under complete turnkey installation contracts are made when contractually determined milestones of progress have been achieved, with payment terms generally being 30 days. Our installation services revenue decreased significantly in the year ended December 31, 2022 and is likely to continue to remain low due to our strategy to focus on higher margin segments of our business.
Energy Production Segment
Energy Production. Revenue from energy contracts is recognized when electricity, heat, hot and/or chilled water is produced by our owned on-site cogeneration systems. Each month we bill the customer and recognize revenue for the various forms of energy delivered, based on meter readings which capture the quantity of the various forms of energy delivered in a given month, under a contractually defined formula which takes into account the current month's cost of energy from the local power utility.
As the various forms of energy delivered by us under energy production contracts are simultaneously delivered and consumed by the customer, our performance obligation under these contracts is considered to be satisfied over time. We use an output method to measure progress towards completion of our performance obligation which results in the recognition of revenue on the basis of a direct measurement of the value to the customer of the services transferred to date relative to the remaining services promised under the contract. We use the practical expedient at ASC 606-10-55-18 of recognizing revenue in an amount equal to that amount to which we have the right to invoice the customer under the contract. Payment terms on invoices under these contracts are generally 30 days.
Contract Balances
The timing of revenue recognition, billings and cash collections result in billed accounts receivable, unbilled revenue (contract assets) and deferred revenue, consisting of customer deposits and billings in excess of revenue recognized (contract liabilities) on the consolidated balance sheets.
We did not recognize any revenue during the year ended December 31, 2022 that was included in unbilled revenue as of December 31, 2022. Approximately $1,475,827 of revenue was billed in this period that had been recognized in previous periods.
TECOGEN INC.
Notes to Audited Consolidated Financial Statements for December 31, 2022 and 2021
Revenue recognized during the year ended December 31, 2022 that was included in deferred revenue at the beginning of the period was $1,669,171.
Remaining Performance Obligations
Remaining performance obligations related to ASC 606 represent the aggregate transaction price allocated to performance obligations with an original contract term greater than one year, excluding certain maintenance contracts and all energy production contracts where a direct measurement of the value to the customer is used as a method of measuring progress towards completion of our performance obligation. Exclusion of these remaining performance obligations is due in part to the inability to quantify values based on unknown future levels of delivery and in some cases rates used to bill customers. Remaining performance obligations therefore consist of unsatisfied or partially satisfied performance obligations related to fixed price maintenance contracts and installation contracts.
As of December 31, 2022, the aggregate amount of the transaction price allocated to remaining performance obligations was approximately $1,487,450. We expect to recognize revenue of approximately 94% of the remaining performance obligations over the next 24 months, 19% recognized in the first 12 months and 75% recognized over the subsequent 12 months, and the remainder recognized thereafter.
Advertising Costs
We expense the costs of advertising as incurred. For the years ended December 31, 2022 and 2021, advertising expense was approximately $51,000 and $47,000, respectively.
Research and Development Costs
Research and development expenditures are expensed as incurred. Our total research and development expenditures were approximately $733,000 and $542,000 for the years ended December 31, 2022 and 2021, respectively.
Stock-Based Compensation
Stock-based compensation cost is measured at the grant date, based on the estimated fair value of the award, and is recognized as an expense in the statements of operations over the requisite service period.
The determination of the fair value of share-based payment awards is affected by our stock price. For the awards issued prior to our being publicly traded, we considered the sales price of the Common Stock in private placements to unrelated third parties as a measure of the fair value of its Common Stock.
We utilize actual forfeitures when calculating the expense for the period. Stock-based compensation expense recognized is based on awards that are ultimately expected to vest. We evaluate the assumptions used to value awards regularly and if factors change and different assumptions are employed, stock-based compensation expense may differ significantly from what has been recorded in the past. If there are any modifications or cancellations of the underlying unvested securities, we may be required to accelerate, increase or cancel any remaining unearned stock-based compensation expense.
See Note 14."Stockholders' equity" for a summary of the restricted stock and stock option activity under our stock-based employee compensation plan for the years ended December 31, 2022 and 2021.
Significant New Accounting Standards Adopted this Period
No new accounting standards were adopted in the year ended December 31, 2022 that had a material impact on our consolidated financial statements.
Note 3 – Income (loss) per common share:
Basic and diluted income (loss) per common share for the years ended December 31, 2022 and 2021, respectively, was as follows:
TECOGEN INC.
Notes to Audited Consolidated Financial Statements for December 31, 2022 and 2021
| | | | | | | | | | | |
| Years Ended | December 31, 2022 | | December 31, 2021 |
| Numerator: | | | |
| Net income (loss) attributable to stockholders | $ | (2,447,927) | | $ | 3,696,000 |
| | | |
| Denominator: | | | |
| Weighted average shares outstanding - Basic | 24,850,261 | | 24,850,261 |
| Effect of dilutive securities: | | | |
| Stock options | — | | | 265,257 | |
| Weighted average shares outstanding - Diluted | 24,850,261 | | | 25,115,518 | |
| | | |
| Basic income (loss) per share | $ | (0.10) | | | $ | 0.15 | |
| Diluted income (loss) per share | $ | (0.10) | | | $ | 0.15 | |
| | | |
| Anti-dilutive shares underlying stock options outstanding | 915,201 | | | 931,396 | |
| | | |
Note 4 – Acquisition of American DG Energy Inc.
On May 18, 2017, we completed our acquisition, by means of a stock-for-stock merger, of 100% of the outstanding common shares of American DG Energy Inc. (“American DG Energy" or "ADGE”), a company which installed, owned, operated and maintained complete distributed generation of electricity systems, or DG systems or energy systems, and other complementary systems at customer sites and sells electricity, hot water, heat and cooling energy under long-term contracts at prices guaranteed to the customer to be below conventional utility rates, by means of a merger of one of our wholly owned subsidiaries with and into ADGE such that ADGE became a wholly owned subsidiary of Tecogen. We acquired ADGE to, among other reasons, expand our product offerings and benefit directly from the long-term contracted revenue streams generated by these installations. We gained control of ADGE on May 18, 2017 by issuing shares of our Common Stock to the prior stockholders of ADGE.
Goodwill of $13.3 million arising from the acquisition is primarily attributable to the going concern element of ADGE’s business, including its assembled workforce and the long-term contractual nature of its business, as well as expected cost synergies from the merger related primarily to the elimination of administrative overhead and duplicative personnel. None of the goodwill recognized is expected to be deductible for income tax purposes.
The favorable contract asset and the unfavorable contract liability, both of which relate to existing customer contracts, and the estimated amortization are more fully described in Note 7. "Intangible assets and liabilities other than goodwill".
Note 5. Sale of Energy Producing Assets and Goodwill Impairment
During the first quarter of 2019, we sold certain energy producing assets, including the associated energy production contracts for total consideration of $7 million.
In connection with the asset sales, we entered into agreements with the purchaser to maintain and operate the assets over the remaining periods of the associated energy production contracts (through August 2033 and January 2034, respectively) in exchange for monthly fees for both maintenance and operation. These agreements contain provisions whereby we have guaranteed to the purchaser a minimum level or threshold of cash flows from the associated energy production contracts. Actual results are compared to the minimum threshold bi-annually and we reimburse any shortfall to the purchaser. To the extent actual results are in excess of the minimum threshold, we are entitled to fifty percent of such excess under the agreements. We received excess payments in both the years ended December 31, 2022 and 2021. For the year ended December 31, 2022, we recognized $101,861 of revenue representing our share of the excess cash flows under the energy production contacts, the current receivable which is included in our consolidated balance sheet as of December 31, 2022. On March 6, 2023, we received the excess payment for the year 2022 from the purchaser. For the year ended December 31, 2021, we recognized $23,803 of revenue representing our share of the excess cash flows under the energy production contracts.
The foregoing agreements also contain provisions whereby we have agreed to make whole the purchaser in the event the counterparty to the energy production contract(s) defaults on or otherwise terminates before the stated expiration of the energy production contract. Should we be required to make whole the purchaser under such provisions, we would be entitled to seek recovery from the counterparty to the energy production contract(s) under a similar provision contained in those contracts in respect of early termination. We did not recognize any counterparty contract default costs in the years ended December 31, 2022 and 2021.
We are also responsible under the agreements for site decommissioning costs, if any, in excess of certain threshold amounts by site. Decommissioning of site assets is performed when, if and as requested by the counterparty to the energy
TECOGEN INC.
Notes to Audited Consolidated Financial Statements for December 31, 2022 and 2021
production contract upon termination of the energy production contract. We did not recognize any site decommissioning costs in the years ended December 31, 2022 and 2021 .
Note 6 – Inventory
Inventories at December 31, 2022 and 2021 consisted of the following.
| | | | | | | | | | | |
| | 2022 | | 2021 |
| | | |
| | | |
| Raw materials, net | $ | 9,001,491 | | | $ | 6,691,991 | |
| Work-in-process | 498,139 | | | 549,802 | |
| Finished goods | 983,099 | | | 523,196 | |
| | $ | 10,482,729 | | | $ | 7,764,989 | |
Note 7 – Intangible Assets and Liabilities Other Than Goodwill
During the years ended December 31, 2022 and 2021 we capitalized $11,615 and $39,691, respectively, of product certification costs. Also included in intangible assets are legal costs incurred by us to obtain patents for our intellectual property. These patents, once they are placed in service, are amortized on a straight-line basis over the estimated economic life of the associated product, which ranges from approximately 7-10 years. We capitalized $17,890 and $23,406 of patent-related costs during the years ended December 31, 2022 and 2021, respectively. We did not capitalize any cost incurred for trademarks during the years ended December 31, 2022 and 2021, respectively.
Intangible assets and liabilities at December 31, 2022 and 2021 consist of the following:
| | | | | | | | | | | | | | | | | | | | | | | | | | | | | | | | | | | | | | |
| | December 31, 2022 | | December 31, 2021 |
| Intangible assets | | Cost | | Accumulated Amortization | | Net | | Cost | | Accumulated Amortization | | Net |
| Product certifications | | $ | 777,465 | | | $ | (584,863) | | | $ | 192,602 | | | $ | 765,850 | | | $ | (532,676) | | | $ | 233,174 | |
| Patents | | 888,910 | | | (405,140) | | | 483,770 | | | 871,021 | | | (314,997) | | | 556,024 | |
| Developed technology | | 240,000 | | | (156,000) | | | 84,000 | | | 240,000 | | | (140,000) | | | 100,000 | |
| Trademarks | | 26,896 | | | — | | | 26,896 | | | 26,896 | | | — | | | 26,896 | |
| In process R&D | | 263,936 | | | (65,984) | | | 197,952 | | | 263,936 | | | (28,279) | | | 235,657 | |
| Favorable contract assets | | 384,465 | | | (372,091) | | | 12,374 | | | 384,465 | | | (355,193) | | | 29,272 | |
| | $ | 2,581,672 | | | $ | (1,584,078) | | | $ | 997,594 | | | $ | 2,552,168 | | | $ | (1,371,145) | | | $ | 1,181,023 | |
| | | | | | | | | | | | |
| Intangible liability | | | | | | | | | | | | |
| Unfavorable contract liability | | $ | 2,618,168 | | | $ | (1,797,951) | | | $ | 820,217 | | | $ | 3,056,655 | | | $ | (1,797,149) | | | $ | 1,259,506 | |
The aggregate amortization expense related to intangible assets exclusive of contract related intangibles was $201,043 and $197,788 during the years ended December 31, 2022 and 2021, respectively. The net credit to cost of sales related to the amortization of the contract related intangible asset and liability for the years ended December 31, 2022 and 2021 was $274,112 and $319,084, respectively. We abandoned certain patent applications and recorded non-cash charges of $0 and $7,400 as long-lived asset impairment in the consolidated statement of operations for the years ended December 31, 2022 and 2021, respectively.
Contract Asset and Liability
The favorable contract asset and unfavorable contract liability in the foregoing table represent the fair value of ADGE's customer contracts (both positive for favorable contracts and negative for unfavorable contracts) which were acquired by us on May 18, 2017 (see Note 4. "Acquisition of American DG Energy Inc."), reduced by those sold during Q1 2019. See Note 5."Sale of Energy Producing Assets and Goodwill Impairment".
During the year ended December 31, 2022, we determined that certain of the ADGE customer contracts terminated due to the customers failure to perform their obligations pursuant to the contractual agreements and accordingly reversed $151,981
TECOGEN INC.
Notes to Audited Consolidated Financial Statements for December 31, 2022 and 2021
of unfavorable contract liability related to these contacts. The adjustments are included in the consolidated statement of operations for the year ended December 31, 2022, as non-cash benefits within long-lived asset impairment.
Amortization of intangibles including contract related amounts is calculated using the straight line method over the remaining useful life or contract term, which range from approximately 1-11 years, and is charged against cost of sales in the accompanying consolidated statement of operations. Aggregate future amortization over the next five years is estimated to be as follows:
| | | | | | | | | | | | | | | | | | | | |
| | Non-contract related intangibles | | Contract related intangibles | | Total |
| 2023 | | $ | 203,295 | | | $ | (236,705) | | | $ | (33,410) | |
| 2024 | | 182,413 | | | (160,325) | | | 22,088 | |
| 2025 | | 177,841 | | | (113,449) | | | 64,392 | |
| 2026 | | 173,702 | | | (65,232) | | | 108,470 | |
| 2027 | | 172,468 | | | (57,591) | | | 114,877 | |
| Thereafter | | 60,979 | | | (186,915) | | | (125,936) | |
| | | $ | 970,698 | | | $ | (820,217) | | | $ | 150,481 | |
Note 8 – Property, plant and equipment
Property, plant and equipment at December 31, 2022 and 2021 consisted of the following:
| | | | | | | | | | | | | | | | | |
| Estimated Useful
Life (in Years) | | 2022 | | 2021 |
| Energy systems | 10 - 15 years | | $ | 2,810,232 | | | $ | 3,556,488 | |
| Machinery and equipment | 5 - 7 years | | 1,624,885 | | | 1,463,153 | |
| Furniture and fixtures | 5 years | | 196,007 | | | 193,698 | |
| Computer software | 3 - 5 years | | 192,865 | | | 192,865 | |
| Leasehold improvements | * | | 466,789 | | | 466,789 | |
| | | | 5,290,778 | | | 5,872,993 | |
| Less - accumulated depreciation and amortization | | | (3,883,058) | | | (4,090,049) | |
| Net property, plant and equipment | | | $ | 1,407,720 | | | $ | 1,782,944 | |
* Lesser of estimated useful life of asset or lease term
Depreciation and amortization expense on property and equipment for the years ended December 31, 2022 and 2021 was $501,418 and $591,047, respectively.
During the year ended December 31, 2022, we determined that three of the ADGE customer contracts terminated due to the customers failure to perform their obligations pursuant to the contractual agreements and deemed the assets related to the contracts at these sites to be impaired. We recorded a non-cash impairment of $156,655 which is included in the consolidated statement of operations for the year ended December 31, 2022, within long-lived asset impairment.
During the year ended December 31, 2021 there were no ADGE contract terminations.
TECOGEN INC.
Notes to Audited Consolidated Financial Statements for December 31, 2022 and 2021
Note 9 - Goodwill
Changes in the carrying amount of goodwill by reportable segment during the years ended December 31, 2022 and 2021 was as follows:
| | | | | | | | | | | | | | | | | |
| Product and Service | | Energy Production | | Total |
| | | | | |
| | | | | |
| | | | | |
| | | | | |
| Balance at December 31, 2020 | $ | 40,870 | | | $ | 2,365,286 | | | $ | 2,406,156 | |
| Impairment | — | | | — | | | — | |
| Balance at December 31, 2021 | $ | 40,870 | | | $ | 2,365,286 | | | $ | 2,406,156 | |
| Impairment | — | | | — | | | — | |
| Balance at December 31, 2022 | $ | 40,870 | | | $ | 2,365,286 | | | $ | 2,406,156 | |
We performed a goodwill impairment test at December 31, 2022 and determined that the estimated fair value of the energy production business assets, based on a discounted cash flow analysis, exceeded the carrying value of the assets and did not record a goodwill impairment for the year 2022.
See Note 5. "Sale of Energy Producing Assets and Goodwill Impairment" for further discussion.
Note 10 – Notes Payable
On April 17, 2020, we obtained an unsecured loan through Webster Bank, N.A. in the amount of $1,874,200 in connection with the Paycheck Protection Program pursuant to the Coronavirus Aid, Relief, and Economic Security Act (the CARES Act”) administered by the United States Small Business Administration (the "SBA").
On January 19, 2021, we received a letter dated January 12, 2021 from Webster Bank, NA confirming that the Paycheck Protection Program Loan to us pursuant to the CARES ACT, as amended, in the original principal amount of $1,874,200 together with accrued interest of $13,659 was forgiven in full as of January 11, 2021. We have accounted for the loan forgiveness of $1,887,859 as debt extinguishment in accordance with Accounting Standards Update 2020-09, Debt (Topic 470) ("ASU 2020-09") and reported as a separate component of other income (expense), net in our condensed consolidated statement of operations for the year ended December 31, 2021. The loan forgiveness is considered to be nontaxable for both state and federal purposes and has been treated accordingly in our condensed consolidated financial statements.
On February 5, 2021, we obtained a Paycheck Protection Program Second Draw unsecured loan through Webster in the amount of $1,874,269 in connection with the Paycheck Protection Program pursuant to the CARES Act. The loan is guaranteed by the United States Small Business Administration.
On September 20, 2021, we received a letter dated September 13, 2021 from Webster Bank, NA confirming that the Paycheck Protection Program Second Draw Loan issued to us pursuant to the CARES Act, as amended, in the original principal amount of $1,874,269 together with accrued interest of $11,386 was forgiven in full as of September 8, 2021. We have accounted for the loan forgiveness of $1,885,655 as debt extinguishment in accordance with Accounting Standards Update 2020-09, Debt (Topic 470) ("ASU 2020-09") and reported as a separate component of other income (expense), net in our condensed consolidated statement of operations for the year ended December 31, 2021. The loan forgiveness is considered to be nontaxable for both state and federal purposes and has been treated accordingly in our condensed consolidated financial statements.
Note 11 – Commitments and contingencies
Operating Lease Obligations
We lease office space and warehouse facilities under various lease agreements which expire through January 2031. Total rent expense for the years ended December 31, 2022 and 2021 amounted to $811,664 and $802,409, respectively. See Note 13. "Leases" for further discussion.
Legal Matters
On November 23, 2022, we were served with a suit filed against us on August 24, 2022 in the Ontario Superior Court of Justice for damages in the amount of CDN $1,000,000, alleging that a Tecogen cogenerator installed by us at the plaintiffs facility caught fire, causing damage to the cogenerator and the plaintiff's facility. For the year ended December 31, 2022, we reserved $150,000 for anticipated costs which may not be covered by insurance. We are not a party to any other material pending legal proceeding.
TECOGEN INC.
Notes to Audited Consolidated Financial Statements for December 31, 2022 and 2021
Guarantees
In connection with the sale of energy producing assets, we made certain guarantees to the purchaser as discussed in Note 5. "Sale of Energy Producing Assets and Goodwill Impairment." On March 6, 2023, we received the excess payment for the year ended December 31, 2022 from the purchaser. Based upon an analysis of these energy producing assets expected future performance, as of December 31, 2022 we do not expect to make any material payments under the guarantee.
Change in Control Severance Benefit Plan
On July 9, 2020, our compensation committee of the board of directors adopted the Tecogen Inc. Change in Control Severance Benefit Plan ("Plan"). The Plan provides for up to 12 months of severance benefits for certain of our key management employees who are selected as plan participants by the plan administrator and who have executed a Change in Control Severance Benefit Plan Participation Notice. On July 9, 2020, Robert A. Panora, our President and Chief Operating Officer, and John K. Whiting, IV, our General Counsel and Secretary, were each designated as participants in the Plan.
Under the Plan, upon the occurrence of certain termination events following a change in control of the Company, the executive participants would receive cash severance payments equal to 12 months’ salary and bonus payments, continuation of certain health benefits, the acceleration of bonus awards, and immediate vesting of outstanding unvested options (including performance options) to acquire our common stock. The severance payments are required to be paid in a single lump sum. The Plan has a term of three years and will automatically extend for successive additional one-year terms unless we provide written notice at least six months in advance of a then current term.
An executive will be entitled to severance under the Plan only if there has been a “Change in Control” of the Company and the termination of employment or service occurs during the period that is three months prior to and 18 months following a change in control of the Company. Also, a participant's employment with the Company must be terminated by a participant for “Good Reason” or be an “Involuntary Termination Without Cause” by the Company, as those terms are defined in the Plan. In order to be eligible to receive severance benefits under the Plan, an executive must comply with the terms of the Plan, including the release and non-revocation of claims in favor of the Company and certain confidentiality, non-compete, non-solicitation, and non-disparagement covenants during and following termination of employment. The Plan will be administered by the compensation committee of the board of directors (or by the full board of directors or such other committee as the board may designate).
Note 12 – Product warranty
We reserve an estimate of our exposure to warranty claims based on both current and historical product sales data and warranty costs incurred. The majority of our products are sold with a one-year warranty. We assesses the adequacy of our recorded warranty liability periodically and adjust the reserve as necessary. The warranty liability is included in accrued expenses on the accompanying consolidated balance sheets.
Changes in our warranty reserve were as follows:
| | | | | |
| Warranty reserve, December 31, 2020 | $ | 164,800 | |
| Warranty provision for units sold | 119,752 | |
| Costs of warranty incurred | (119,752) | |
| Warranty reserve, December 31, 2021 | 164,800 | |
| Warranty provision for units sold | 208,730 | |
| Costs of warranty incurred | (235,730) | |
| Warranty reserve, December 31, 2022 | $ | 137,800 | |
Note 13 – Leases
Our leases principally consist of operating leases related to our corporate office, field offices, and our research, manufacturing and storage facilities. Our lease terms do not include options to extend or terminate the lease until we are reasonably certain that we will exercise that option.
Some of our lease arrangements contain lease components (e.g. minimum rent payments) and non-lease components (e.g. maintenance, labor charges, etc.). We account for each component separately based on the estimated standalone price of each component.
TECOGEN INC.
Notes to Audited Consolidated Financial Statements for December 31, 2022 and 2021
Operating leases are included in Right-of-use assets, Lease obligations, current and Lease obligations, long term on the consolidated balance sheets. These assets and liabilities are recognized at the commencement date based on the present value of remaining lease payments over the lease term using an incremental borrowing rate consistent with the lease terms or implicit rates, when readily determinable. Short-term operating leases, which have an initial term of 12 months or less, are not recorded on the balance sheet.
Lease expense for operating leases, which principally consists of fixed payments for base rent, is recognized on a straight-line basis over the lease term. Lease expense for the years ended December 31, 2022 and 2021 was $811,664 and $802,409, respectively.
Supplemental information related to operating leases for the years ended December 31, 2022 and 2021 was as follows:
| | | | | | | | | | | | | | |
| | December 31, 2022 | | December 31, 2021 |
| Cash paid for amounts included in the measurement of operating lease liabilities | | $ | 733,284 | | | $ | 715,639 | |
| Right-of-use assets obtained in exchange for operating lease liabilities | | $ | — | | | $ | 825,848 | |
| Weighted-average remaining lease term - operating leases | | 3.6 Years | | 4.0 Years |
| Weighted-average discount rate - operating leases | | 6.0 | % | | 6.0 | % |
Supplemental balance sheet information related to operating leases for the years ended December 31, 2022 and 2021 was as follows:
| | | | | | | | | | | | | | |
| | December 31, 2022 | | December 31, 2021 |
| Operating leases | | | | |
| Right-of-use assets | | $ | 1,245,549 | | | $ | 1,869,210 | |
| | | | |
| Operating lease liability, current | | $ | 687,589 | | | $ | 641,002 | |
| Operating lease liability, long-term | | 623,452 | | | 1,315,275 | |
| Total operating lease liability | | $ | 1,311,041 | | | $ | 1,956,277 | |
Future minimum lease commitments under non-cancellable operating leases as of December 31, 2022 were as follows:
| | | | | | | | |
| | Operating Leases |
| 2023 | | $ | 742,158 | |
| 2024 | | 249,681 | |
| 2025 | | 123,908 | |
| 2026 | | 111,260 | |
| 2027 | | 52,765 | |
| Thereafter | | 171,086 | |
| Total lease payments | | 1,450,858 | |
| Less: imputed interest | | 139,817 | |
| Total | | $ | 1,311,041 | |
Note 14 – Stockholders’ equity
Common Stock
The holders of our Common Stock have the right to vote their interest on a per share basis. At December 31, 2022 and 2021, there were 24,850,261 and 24,850,261 shares of our Common Stock outstanding, respectively.
TECOGEN INC.
Notes to Audited Consolidated Financial Statements for December 31, 2022 and 2021
Preferred Stock
On February 13, 2013, we authorized 10 million shares of preferred stock. As of December 31, 2022, no preferred shares were issued or outstanding.
Stock-Based Compensation
We adopted the 2006 Stock Option and Incentive Plan (the “Plan”), under which the board of directors may grant incentive or non-qualified stock options and stock grants to key employees, directors, advisors and our consultants. The Plan was amended at various dates by the Board of Directors to increase the reserved shares of common stock issuable under the Plan to 3,838,750 as of December 31, 2022, and in June 2017 stockholders approved an amendment to extend the termination date of the Plan to January 1, 2026 and to ratify all of our option grants issued after January 1, 2016 (the “Amended Plan”).
Stock options vest based upon the terms within the individual option grants, with an acceleration of the unvested portion of such options upon a change in control event, as defined in the Amended Plan. The options are not transferable except by will or domestic relations order. The option price per share under the Amended Plan cannot be less than the fair market value of the underlying shares on the date of the grant. The number of shares remaining available for future issuance under the Amended Plan as of December 31, 2022 and 2021 was 146,393 and 764,768, respectively.
In 2022, we granted nonqualified options to purchase an aggregate of 761,650 shares of common stock at prices between $1.10 per share to $1.20 per share to certain officers and employees. These options have a vesting schedule of 4 years and expire in ten years. The fair value of the options issued in 2022 was $321,910. The weighted-average grant date fair value of stock options granted during 2022 was $0.42 per share.
In 2021, we granted nonqualified options to purchase an aggregate of 258,000 shares of common stock at $1.75 per share to certain officers and employees. These options have a vesting schedule of 4 years and expire in ten years. The fair value of the options issued in 2022 was $166,474. The weighted-average grant date fair value of stock options granted during 2022 was $0.65 per share.
We adopted the 2022 Stock Incentive Plan (the "2022 Plan"), under which the Board of Directors may grant incentive or non-qualified stock options and stock grants to key employees, directors, advisors and consultants. We have reserved 3,800,000 shares of our common stock for issuance pursuant to awards under the 2022 Plan. The adoption of the 2022 Plan was approved by our shareholders on June 9, 2022.
Under the 2022 Plan, stock options vest based upon the terms within the individual option grants, with an acceleration of the unvested portion of such options upon a change in control event, as defined in the 2022 Plan. The options are not transferable except by will or domestic relations order. The option price per share under the 2022 Plan cannot be less than the fair market value of the underlying shares on the date of the grant.
During the year ended December 31, 2022, we granted nonqualified options to purchase an aggregate of 275,000 shares of common stock at prices between of $1.00 per share and $1.41 per share to certain directors. These options have a vesting schedule of four years and expire in ten years. The fair value of the options issued in 2022 was $145,600. The weighted-average grant date fair value of stock options granted during 2022 was $0.53 per share. The number of shares remaining available for future issuance under the 2022 Plan as of December 31, 2022 was 3,600,000.
In 2022 and 2021, there were no options exercised.
Stock option activity for the year ended December 31, 2022 was as follows:
TECOGEN INC.
Notes to Audited Consolidated Financial Statements for December 31, 2022 and 2021
| | | | | | | | | | | | | | | | | | | | | | | | | | | | | | | | | | | |
| Common Stock Options | Number of
Options | | Exercise
Price
Per
Share | | Weighted
Average
Exercise
Price | | Weighted
Average
Remaining
Life | | Aggregate
Intrinsic
Value |
| Outstanding, December 31, 2021 | 2,386,842 | | | $ | 0.71 | | — | $ | 10.33 | | | $ | 1.81 | | | 7.56 years | | $ | 697,935 | |
| Granted | 1,036,650 | | | $ | 1.00 | | — | $ | 1.41 | | | $ | 1.14 | | | | | |
| | | | | | | | | | | |
| Exercised | — | | | — | | | | | | |
| Canceled and forfeited | (219,195) | | | $ | 1.00 | | — | $ | 6.74 | | $ | 1.58 | | | | | |
| | | | | | | | | | | |
| | | | | | | | | | | |
| Outstanding, December 31, 2022 | 3,204,297 | | | $ | 0.71 | | — | $ | 10.33 | | | $ | 1.61 | | | 7.30 years | | $ | 882,074 | |
| Exercisable, December 31, 2022 | 1,421,147 | | | | | | | $ | 2.32 | | | | | $ | 391,257 | |
| Vested and expected to vest, December 31, 2022 | 2,936,825 | | | | | | | $ | 1.66 | | | | | $ | 808,252 | |
We used a forfeiture rate of 15% to calculate the expected to vest shares in the table above. We use the Black-Scholes option pricing model to determine the fair value of stock options granted. Use of a valuation model requires management to make certain assumptions with respect to selected model inputs. Expected volatility was calculated based on the average volatility of four comparable publicly traded companies. The average expected life was estimated using the simplified method to determine the expected life based on the vesting period and contractual terms, since we do not have the necessary historical exercise data to determine an expected life for stock options. We use a single weighted-average expected life to value option awards and recognize compensation on a straight-line basis over the requisite service period for each separately vesting portion of the awards. The risk-free interest rate is based on U.S. Treasury zero-coupon issues with a remaining term which approximates the expected life assumed at the date of grant.
The weighted average assumptions used in the Black-Scholes option pricing model for options granted in 2022 and 2021 are as follows:
| | | | | | | | | | | | | | |
| Stock option awards: | | 2022 | | 2021 |
| Expected life | | 6.25 years | | 6.25 years |
| Risk-free interest rate | | 2.17% | | 1.09% |
| Expected volatility | | 36.24% | | 35.86% |
During the years ended December 31, 2022 and 2021, we recognized stock-based compensation expense of $334,149 and $202,431, respectively, related to the issuance of stock options. No tax benefit was recognized related to the stock-based compensation expense recorded during either of the years. At December 31, 2022 and 2021, the total compensation cost related to unvested stock option awards not yet recognized is $500,059 and $470,063, respectively. This amount will be recognized over a weighted average period of 1.58 years.
Note 15 – Fair value measurements
The fair value topic of the FASB Accounting Standards Codification defines fair value as the exchange price that would be received for an asset or paid to transfer a liability (an exit price) in the principal or most advantageous market for the asset or liability in an orderly transaction between market participants on the measurement date. The accounting guidance also establishes a fair value hierarchy which requires an entity to maximize the use of observable inputs, where available, and minimize the use of unobservable inputs when measuring fair value. There are three levels of inputs that may be used to measure fair value:
Level 1 - Unadjusted quoted prices in active markets for identical assets or liabilities. We currently do not have any Level 1 financial assets or liabilities.
Level 2 - Observable inputs other than quoted prices included in Level 1. Level 2 inputs include quoted prices for identical assets or liabilities in non-active markets, quoted prices for similar assets or liabilities in active markets and inputs other than quoted prices that are observable for substantially the full term of the asset or liability.
Level 3 - Unobservable inputs reflecting management’s own assumptions about the input used in pricing the asset or liability. We currently do not have any Level 3 financial assets or liabilities.
The following table presents the asset reported in the consolidated balance sheet measured at its fair value on a recurring basis as of December 31, 2022 and 2021 by level within the fair value hierarchy.
TECOGEN INC.
Notes to Audited Consolidated Financial Statements for December 31, 2022 and 2021
| | | | | | | | | | | | | | | | | | | | | | | | | | | | | |
| | | Quoted prices in active markets for identical assets | | Significant other observable inputs | | Significant unobservable inputs | | |
| Total | | Level 1 | | Level 2 | | Level 3 | | Unrealized gain (loss) |
| December 31, 2022 | | | | | | | | | |
| Recurring fair value measurements | | | | | | | | | |
| Available-for-sale equity securities | | | | | | | | | |
| EuroSite Power Inc. | $ | 93,744 | | | $ | — | | | $ | 93,744 | | | $ | — | | | $ | 18,749 | |
| Total recurring fair value measurements | $ | 93,744 | | | $ | — | | | $ | 93,744 | | | $ | — | | | $ | 18,749 | |
| | | | | | | | | |
| | | | | | | | | |
| December 31, 2021 | | | | | | | | | |
| Recurring fair value measurements | | | | | | | | | |
| Available-for-sale equity securities | | | | | | | | | |
| EuroSite Power Inc. | $ | 74,995 | | | $ | — | | | $ | 74,995 | | | $ | — | | | $ | (37,498) | |
| Total recurring fair value measurements | $ | 74,995 | | | $ | — | | | $ | 74,995 | | | $ | — | | | $ | (37,498) | |
We utilize a Level 2 category fair value measurement to value our investment in EuroSite Power Inc. as an available-for-sale security at period end. That measurement is equal to the quoted market closing price at period end. Since this security is not actively traded we are classifying as Level 2.
The following table summarizes changes in Level 2 assets which are comprised of marketable equity securities for the years ended December 31, 2022 and 2021:
| | | | | |
| Fair value at December 31, 2020 | $ | 118,084 | |
| Sale of 93,187 shares | (5,592) | |
| Unrealized loss | (37,497) | |
| Fair value at December 31, 2021 | $ | 74,995 | |
| |
| Fair value at December 31, 2021 | $ | 74,995 | |
| Unrealized gain | 18,749 | |
| Fair value at December 31, 2022 | $ | 93,744 | |
Note 16 – Retirement plans
We have a defined contribution retirement plan (the “Plan”), which qualifies under Section 401(k) of the Internal Revenue Code (IRC). Under the Plan, employees meeting certain requirements may elect to contribute a percentage of their salary up to the maximum allowed by the IRC. We matched a variable amount based on participant contributions up to a maximum of 4.5% of each participant’s salary until May 2020 when we discontinued the matching of employee contributions for those employees not covered under a collective bargaining agreement. We contributed approximately $39,664 and $37,560 in matching contributions to the Plan in 2022 and 2021, respectively.
Note 17 – Segments
As of December 31, 2022, we were organized into three operating segments through which senior management evaluates our business. These segments, as described in more detail in Note 1, are organized around the products and services provided to customers and represent our reportable segments. Prior to the acquisition of ADGE (see Note 4. "Acquisition of
TECOGEN INC.
Notes to Audited Consolidated Financial Statements for December 31, 2022 and 2021
American DG Energy Inc."), our operations consisted of a single segment. The following table presents information by reportable segment for the years ended December 31, 2022 and 2021:
| | | | | | | | | | | | | | | | | | | | | | | | | | | | | | | | |
| | Products | | Services | | Energy Production | | Corporate, other and elimination (1) | | Total |
| Year ended December 31, 2022 | | | | | | | | | | |
| Revenue - external customers | | $ | 11,156,099 | | | $ | 12,060,661 | | | $ | 1,785,854 | | | $ | — | | | $ | 25,002,614 | |
| Intersegment revenue | | — | | | 310,816 | | | — | | | (310,816) | | | — | |
| Total revenue | | $ | 11,156,099 | | | $ | 12,371,477 | | | $ | 1,785,854 | | | $ | (310,816) | | | $ | 25,002,614 | |
| Gross profit | | $ | 3,742,779 | | | $ | 6,535,168 | | | $ | 788,864 | | | $ | — | | | $ | 11,066,811 | |
| Identifiable assets | | $ | 10,434,727 | | | $ | 9,854,279 | | | $ | 3,744,913 | | | $ | 4,218,938 | | | $ | 28,252,857 | |
| | | | | | | | | | |
| Year ended December 31, 2021 | | | | | | | | | | |
| Revenue - external customers | | $ | 10,133,329 | | | $ | 12,525,594 | | | $ | 1,739,150 | | | $ | — | | | $ | 24,398,073 | |
| Intersegment revenue | | — | | | 321,618 | | | — | | | (321,618) | | | — | |
| Total revenue | | $ | 10,133,329 | | | $ | 12,847,212 | | | $ | 1,739,150 | | | $ | (321,618) | | | $ | 24,398,073 | |
| Gross profit | | $ | 4,532,283 | | | $ | 6,390,641 | | | $ | 664,729 | | | $ | — | | | $ | 11,587,653 | |
| Identifiable assets | | $ | 11,887,063 | | | $ | 10,820,487 | | | $ | 4,097,935 | | | $ | 5,556,737 | | | $ | 32,362,222 | |
| (1) Corporate, intersegment revenue, other and elimination includes various corporate assets. |
|
TECOGEN INC.
Notes to Audited Consolidated Financial Statements for December 31, 2022 and 2021
Note 18 – Income taxes
A reconciliation of the federal statutory income tax provision to our actual provision for the years ended December 31, 2022 and 2021 is as follows:
| | | | | | | | | | | | | | | | | | | |
| | | | 2022 | | | 2021 | |
| Pre-tax book income (loss) | | $ | (2,381,360) | | | | $ | 3,760,508 | | |
Expected tax at 21% | | (500,086) | | | | 789,707 | | |
| | | | | | | |
| Permanent differences: | | | | | | |
| | | | | | | |
| Mark to market | | (3,937) | | | | 6,605 | | |
| Intangible amortization | | (89,480) | | | | (67,008) | | |
| Paycheck protection program loan forgiveness | | — | | | | (792,333) | | |
| | | | | | | |
| Other | | 2,404 | | | | 3,873 | | |
| | | | | | | |
| State taxes: | | | | | | |
| Current | | 16,352 | | | | 19,491 | | |
| Deferred | | (162,688) | | | | (15,672) | | |
| | | | | | | |
| Other items: | | | | | | |
| Federal research and development credits | | (7,647) | | | | 9,551 | | |
| Deferred tax past year true-up's | | (46,786) | | | | (15,228) | | |
| Change in valuation allowance | | 668,326 | | | | 84,000 | | |
| Capitalized research and development expenses | | 174,674 | | | | — | | |
| | | | | | | |
| | | | | | | |
| | | | | | | |
| Other | | (34,780) | | | | (3,495) | | |
| Income tax provision | | $ | 16,352 | | | | $ | 19,491 | | |
The components of net deferred tax assets recognized in the accompanying consolidated balance sheets at December 31, 2022 and 2021 are as follows:
| | | | | | | | | | | | | | |
| | 2022 | | 2021 |
| Net operating loss carryforwards | $ | 9,812,000 | | | $ | 9,293,000 | |
| R&D and ITC credit carryforwards | 310,000 | | | 303,000 | |
| Accrued expenses and other | 317,000 | | | 338,000 | |
| Intangibles | 342,000 | | | 176,000 | |
| Leases | 17,000 | | | 22,000 | |
| Accounts receivable | 96,000 | | | 141,000 | |
| Stock options | 386,000 | | | 288,000 | |
| Inventory | 366,000 | | | 265,000 | |
| Property, plant and equipment | 705,000 | | | 754,000 | |
| Other | 342,000 | | | 270,000 | |
| Deferred tax assets | 12,693,000 | | | 11,850,000 | |
| Valuation allowance | (12,693,000) | | | (11,850,000) | |
| Deferred tax assets, net | $ | — | | | $ | — | |
At December 31, 2022, we had approximately $39,321,000 of Federal net operating loss carryforwards ("NOL") of which $27,366,000 expire beginning in 2023 through 2038 and $11,955,000 have an indefinite carryforward. In addition, we have $1,557,000 of state net operating losses, expiring at various dates starting in 2023 through 2041.
Effective January 1, 2022, all Section 174 research and development expenditures are required to be capitalized and amortized for tax purposes. The impact of this treatment creates a timing difference that gave rise to a deferred tax asset as of December 31, 2022.
TECOGEN INC.
Notes to Audited Consolidated Financial Statements for December 31, 2022 and 2021
The Tax Cuts and Jobs Act was enacted on December 22, 2017. A significant provision of the act was to reduce the statutory Federal tax rate from 34% to 21%. During 2022, our valuation allowance increased by $843,000. This increase is affected by the absorption of deferred tax attributes associated with its acquisition of American DG Energy, Inc. along with permanent book to tax differences and provision to return adjustments.
On March 27, 2020, the Coronavirus Aid, Relief, and Economic Security Act ("CARES Act"), a sweeping stimulus bill intended to bolster the U.S. economy, and provide emergency assistance to qualifying businesses and individuals, was enacted and signed into law in response to the COVID-19 pandemic. The CARES Act, among other things, permits net operating loss carryovers and carrybacks to offset 100% of taxable income for taxable years beginning before 2021. In addition, the CARES Act allows net operating losses incurred in tax years 2018 through 2020 to be carried back to each of the five preceding taxable years to generate a refund of previously paid income taxes. The CARES Act also modifies the limitation of business interest expense for the tax years beginning in 2019 and 2020. The modifications to Section 163(j) of the Internal Revenue Code increases the allowable business interest deduction from 30% of adjusted taxable income to 50%. The modifications are not expected to materially effect us, as our adjusted taxable income is below zero for the tax years beginning in 2019 and 2020.
On January 12, 2021, we received confirmation that the Paycheck Protection Program Loan to us pursuant to the Coronavirus Aid, Relief, and Economic Recovery Act, as amended, in the original principal amount of $1,874,200 together with accrued interest of $13,659 was forgiven in full as of January 11, 2021. On September 20, 2021, we received confirmation that the Paycheck Protection Program Second Draw Loan issued to us pursuant to the CARES Act, as amended, in the original principal amount of $1,874,269 together with accrued interest of $11,386 was forgiven in full as of September 8, 2021. The PPP loan forgiveness are considered to be nontaxable for both state and federal purposes and has been treated accordingly in our condensed consolidated financial statements.
In accordance with the provisions of the Income Taxes topic of the Codification, we have evaluated the positive and negative evidence bearing upon the realizability of our deferred tax assets, which are comprised principally of net operating losses. Management has determined that it is more likely than not that we will not recognize the benefits of federal and state deferred tax assets and, as a result, a full valuation allowance has been established for 2021 and 2022 respectively.
Utilization of the NOL and research and development credit carryforwards are subject to a substantial annual limitation due to ownership changes, as provided by Section 382 of the Internal Revenue Code of 1986, as well as similar state provisions. Ownership changes may limit the amount of NOL and tax credit carryforwards that can be utilized to offset future taxable income and tax, respectively. In general, an ownership change, as defined by Section 382, results from transactions increasing the ownership of certain shareholders or public groups in the stock of a corporation by more than 50 percentage points over a three-year period.
We acquired American DG Energy, Inc. during 2017, by acquiring 100 percent of the company's stock. Accordingly, utilization of their consolidated and/or separately computed NOL and/or tax credit carryforwards will be subject to an annual limitation under Internal Revenue Code Section 382. Any such limitation may result in expiration of a portion of the NOL or tax credit carryforwards before utilization. The extent of the limitation, and related allocation and impact upon the NOL and credit carryforwards has been determined to be $391,940 per year for a 20 year period at the ADGE level. However, we have sufficient pre-merger NOLs to offset anticipated taxable income for the taxable year ended December 31, 2022 and do not expected to be limited in NOL utilization for the period.
A full valuation allowance has been provided against our loss carryforwards and, if an adjustment is required under Section 382, it would be offset by a corresponding adjustment to the valuation allowance. Thus, there would be no impact to the balance sheet or statement of operations if an adjustment were required.
We have not recorded any amounts for unrecognized tax benefits as of December 31, 2022 or 2021.
We file tax returns as prescribed by the tax laws of the jurisdiction in which we operate. In the normal course of business, we are subject to examination by federal and state jurisdictions, where applicable. There are currently no pending tax examinations. Our tax returns from tax year 2019 are still open for examination for both federal and state jurisdictions.
Note 19 - Subsequent Events
We have evaluated events through the date of this filing, and, except as described below, have determined that no material subsequent events occurred that would require recognition in the consolidated financial statements or disclosure in the notes thereto.
TECOGEN INC.
Notes to Audited Consolidated Financial Statements for December 31, 2022 and 2021
On March 15, 2023, we entered into an Agreement with Aegis Energy Services, LLC (“Aegis”) regarding the assignment and assumption of certain maintenance agreements, the purchase and sale of certain assets, and related matters (the “Agreement”) pursuant to which we agreed to assume Aegis’ rights and obligations arising on or after April 1, 2023 (the anticipated closing date) under Maintenance Agreements for 202 cogeneration systems, and acquire certain vehicles and inventory used in connection with the performance of maintenance services. The Agreement also provides that we will hire certain Aegis employees who will continue to provide maintenance services relating to the cogeneration systems, and that Aegis will provide transitional services relating to the assumed Maintenance Agreements. At the closing, we will acquire certain Aegis vehicles for $170,000, and between the closing and June 30, 2023, we will acquire from Aegis inventory used to provide maintenance services in exchange for a credit of $300,000 to be used for purchases by Aegis of our cogeneration equipment on or before June 30, 2023. Following the closing, for a period of up to seven years, we will pay Aegis a portion of the revenue collected for maintenance services provided pursuant to the assumed Maintenance Agreements. We also have the right to assume Aegis’ remaining Maintenance Agreements for cogeneration systems on the same terms and conditions but effective December 31, 2023 to the extent that Aegis is permitted to assign such agreements to us in accordance with the terms of such agreements.
We are currently evaluating the accounting implications of this transaction.