OTCQX: TGEN Q2 2023 EARNINGS CALL AUGUST 10, 2023 1
MANAGEMENT Abinand Rangesh – CEO & CFO Robert Panora – COO & President Roger Deschenes – CAO Jack Whiting – General Counsel & Secretary 2
SAFE HARBOR STATEMENT This presentation and accompanying documents contain “forward-looking statements” which may describe strategies, goals, outlooks or other non- historical matters, or projected revenues, Income, returns or other financial measures, that may include words such as "believe," "expect," "anticipate," "intend," "plan," "estimate," "project," "target," "potential," "will," "should," "could," "likely," or "may" and similar expressions intended to identify forward-looking statements. These statements are only predictions and involve known and unknown risks, uncertainties, and other factors that may cause our actual results to differ materially from those expressed or implied by such forward-looking statements. Given these uncertainties, you should not place undue reliance on these forward-looking statements. Forward-looking statements speak only as of the date on which they are made, and we undertake no obligation to update or revise any forward-looking statements. In addition to those factors described in our Annual Report on Form 10-K and our Quarterly Reports on Form 10-Q under “Risk Factors”, among the factors that could cause actual results to differ materially from past and projected future results are the following: fluctuations in demand for our products and services, competing technological developments, issues relating to research and development, the availability of incentives, rebates, and tax benefits relating to our products and services, changes in the regulatory environment relating to our products and services, integration of acquired business operations, and the ability to obtain financing on favorable terms to fund existing operations and anticipated growth. In addition to GAAP financial measures, this presentation includes certain non-GAAP financial measures, including adjusted EBITDA which excludes certain expenses as described in the presentation. We use Adjusted EBITDA as an internal measure of business operating performance and believe that the presentation of non-GAAP financial measures provides a meaningful perspective of the underlying operating performance of our current business and enables investors to better understand and evaluate our historical and prospective operating performance by eliminating items that vary from period to period without correlation to our core operating performance and highlights trends in our business that may not otherwise be apparent when relying solely on GAAP financial measures. 3
AGENDA Progress Update 2Q 2023 Results Q&A 4
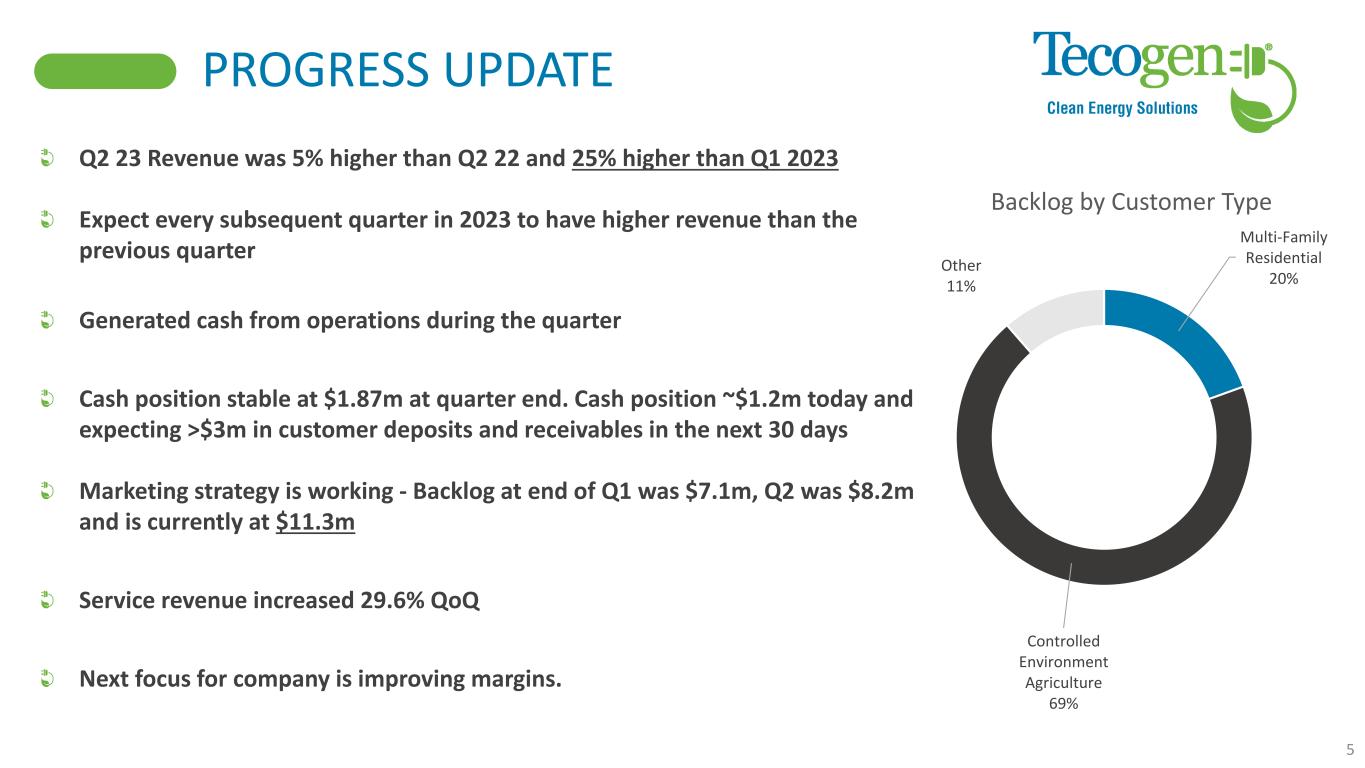
PROGRESS UPDATE Q2 23 Revenue was 5% higher than Q2 22 and 25% higher than Q1 2023 Expect every subsequent quarter in 2023 to have higher revenue than the previous quarter Generated cash from operations during the quarter Cash position stable at $1.87m at quarter end. Cash position ~$1.2m today and expecting >$3m in customer deposits and receivables in the next 30 days Marketing strategy is working - Backlog at end of Q1 was $7.1m, Q2 was $8.2m and is currently at $11.3m Service revenue increased 29.6% QoQ Next focus for company is improving margins. Multi-Family Residential 20% Controlled Environment Agriculture 69% Other 11% Backlog by Customer Type 5
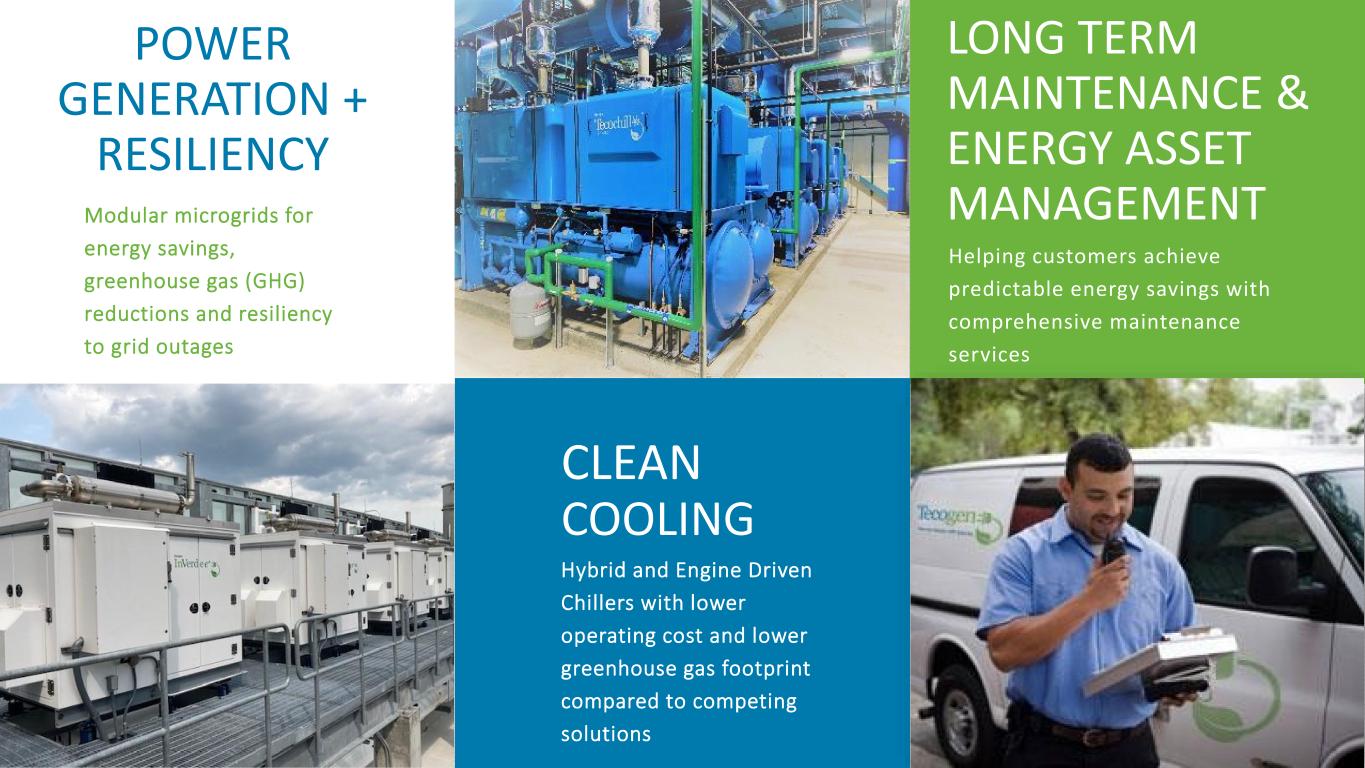
POWER GENERATION + RESILIENCY CLEAN COOLING Hybrid and Engine Driven Chillers with lower operating cost and lower greenhouse gas footprint compared to competing solutions LONG TERM MAINTENANCE & ENERGY ASSET MANAGEMENTModular microgrids for energy savings, greenhouse gas (GHG) reductions and resiliency to grid outages Helping customers achieve predictable energy savings with comprehensive maintenance services
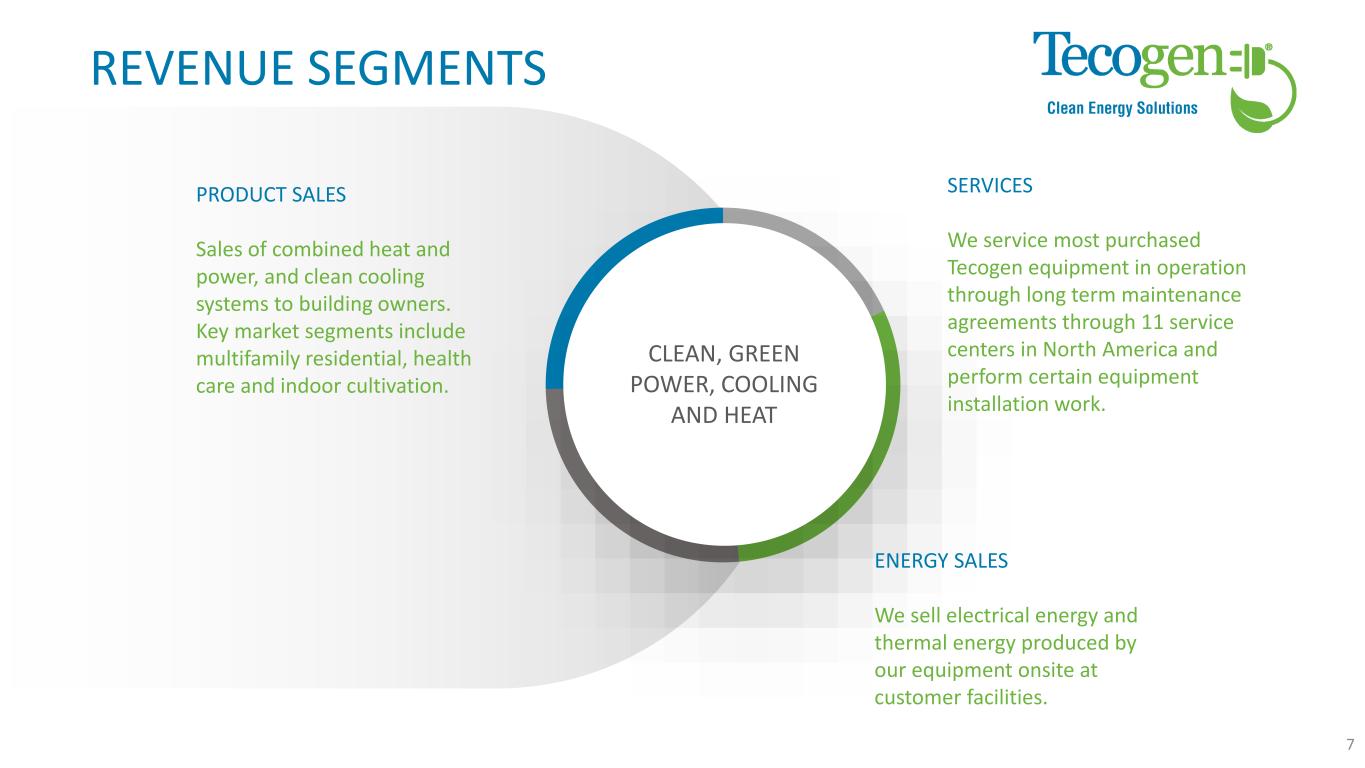
REVENUE SEGMENTS We service most purchased Tecogen equipment in operation through long term maintenance agreements through 11 service centers in North America and perform certain equipment installation work. SERVICES CLEAN, GREEN POWER, COOLING AND HEAT Sales of combined heat and power, and clean cooling systems to building owners. Key market segments include multifamily residential, health care and indoor cultivation. PRODUCT SALES We sell electrical energy and thermal energy produced by our equipment onsite at customer facilities. ENERGY SALES 7
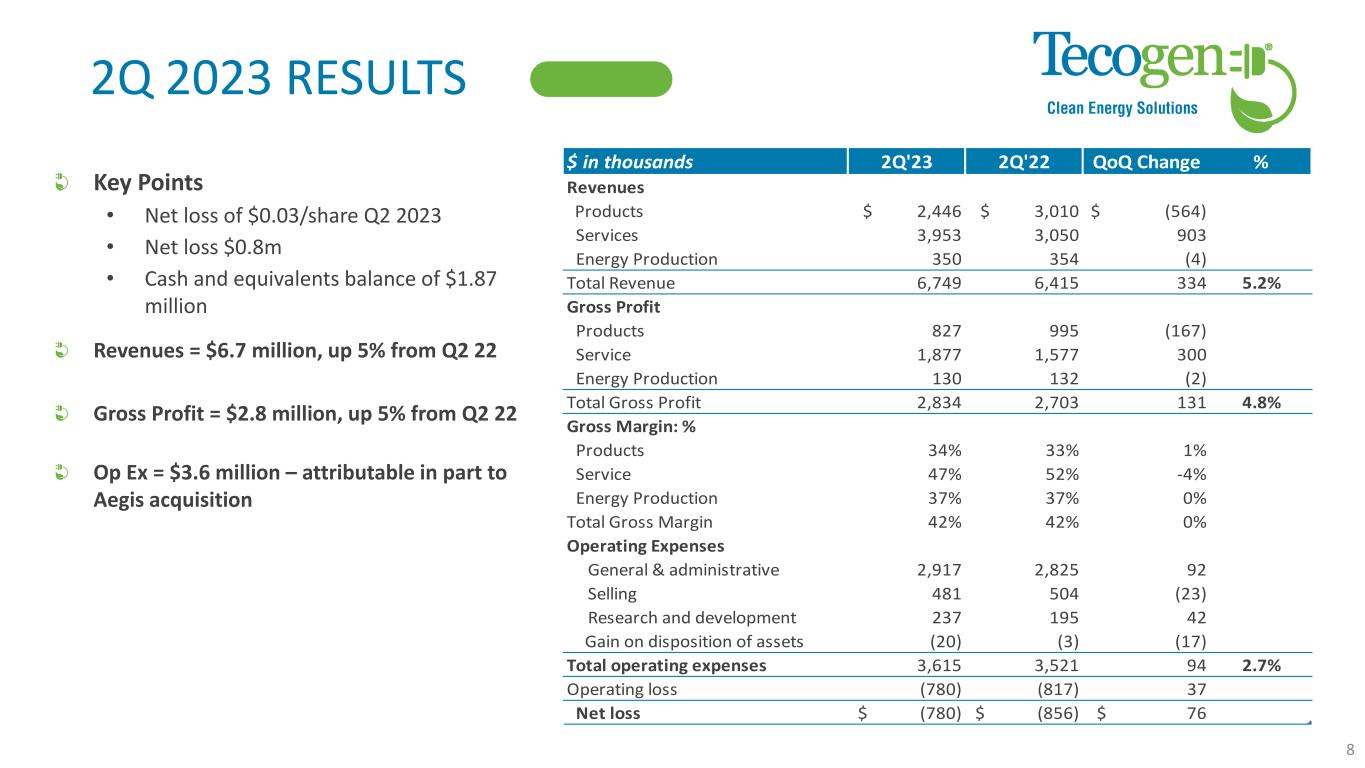
2Q 2023 RESULTS Key Points • Net loss of $0.03/share Q2 2023 • Net loss $0.8m • Cash and equivalents balance of $1.87 million Revenues = $6.7 million, up 5% from Q2 22 Gross Profit = $2.8 million, up 5% from Q2 22 Op Ex = $3.6 million – attributable in part to Aegis acquisition 8 $ in thousands 2Q'23 2Q'22 QoQ Change % Revenues Products $ 2,446 $ 3,010 $ (564) Services 3,953 3,050 903 Energy Production 350 354 (4) Total Revenue 6,749 6,415 334 5.2% Gross Profit Products 827 995 (167) Service 1,877 1,577 300 Energy Production 130 132 (2) Total Gross Profit 2,834 2,703 131 4.8% Gross Margin: % Products 34% 33% 1% Service 47% 52% -4% Energy Production 37% 37% 0% Total Gross Margin 42% 42% 0% Operating Expenses General & administrative 2,917 2,825 92 Selling 481 504 (23) Research and development 237 195 42 Gain on disposition of assets (20) (3) (17) Total operating expenses 3,615 3,521 94 2.7% Operating loss (780) (817) 37 -4.5% Net loss $ (780) $ (856) $ 76 -8.9%
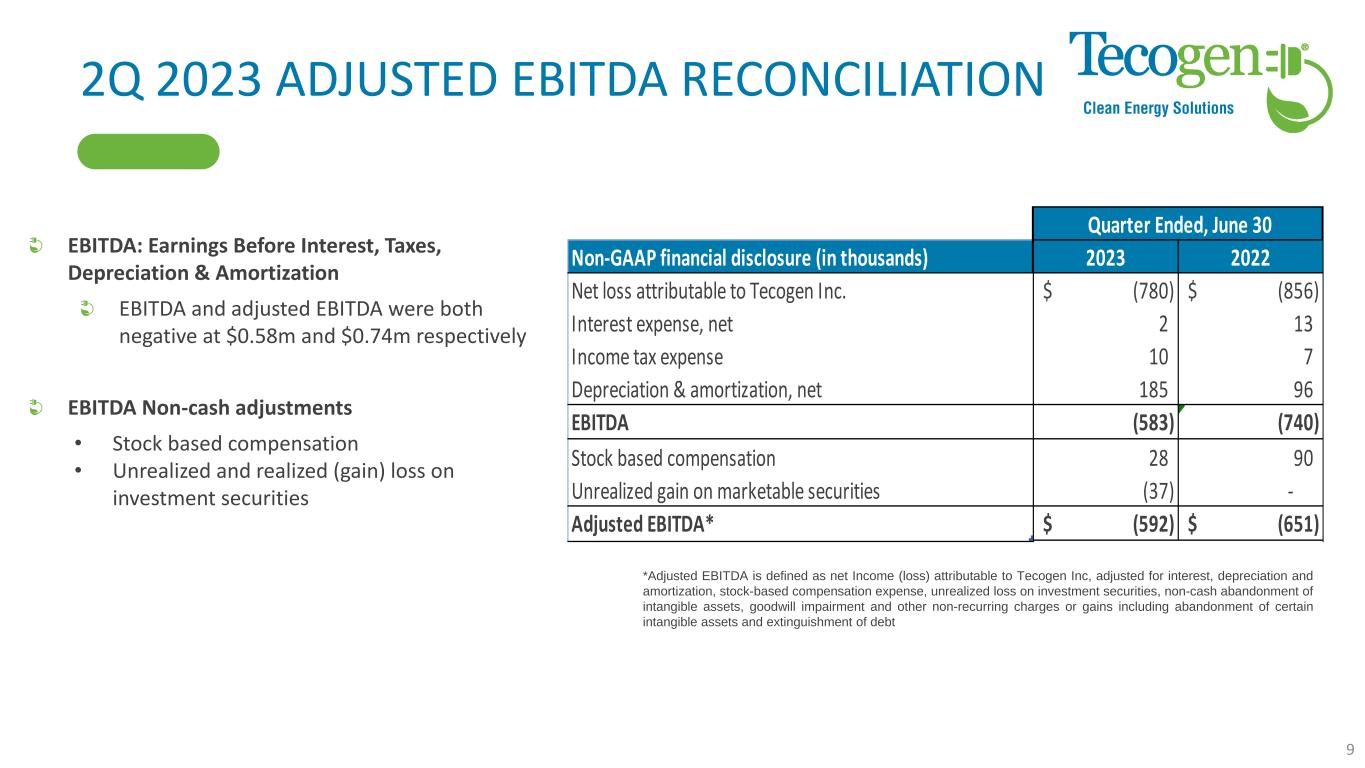
2Q 2023 ADJUSTED EBITDA RECONCILIATION EBITDA: Earnings Before Interest, Taxes, Depreciation & Amortization EBITDA and adjusted EBITDA were both negative at $0.58m and $0.74m respectively EBITDA Non-cash adjustments • Stock based compensation • Unrealized and realized (gain) loss on investment securities *Adjusted EBITDA is defined as net Income (loss) attributable to Tecogen Inc, adjusted for interest, depreciation and amortization, stock-based compensation expense, unrealized loss on investment securities, non-cash abandonment of intangible assets, goodwill impairment and other non-recurring charges or gains including abandonment of certain intangible assets and extinguishment of debt 9 Non-GAAP financial disclosure (in thousands) 2023 2022 Net loss attributable to Tecogen Inc. (780)$ (856)$ Interest expense, net 2 13 Income tax expense 10 7 Depreciation & amortization, net 185 96 EBITDA (583) (740) Stock based compensation 28 90 Unrealized gain on marketable securities (37) - Adjusted EBITDA* (592)$ (651)$ Quarter Ended, June 30
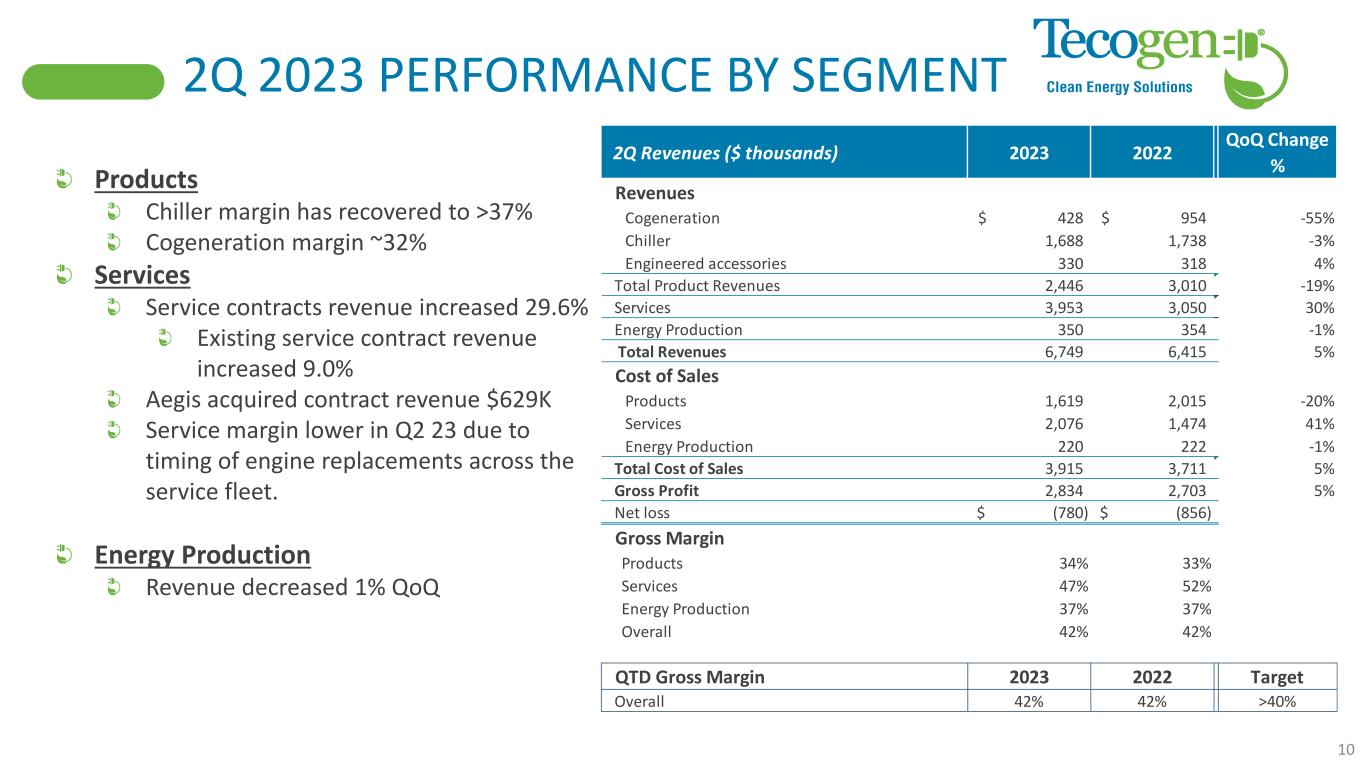
2Q 2023 PERFORMANCE BY SEGMENT Products Chiller margin has recovered to >37% Cogeneration margin ~32% Services Service contracts revenue increased 29.6% Existing service contract revenue increased 9.0% Aegis acquired contract revenue $629K Service margin lower in Q2 23 due to timing of engine replacements across the service fleet. Energy Production Revenue decreased 1% QoQ 10 2Q Revenues ($ thousands) 2023 2022 QoQ Change % Revenues Cogeneration 428$ 954$ -55% Chiller 1,688 1,738 -3% Engineered accessories 330 318 4% Total Product Revenues 2,446 3,010 -19% Services 3,953 3,050 30% Energy Production 350 354 -1% Total Revenues 6,749 6,415 5% Cost of Sales Products 1,619 2,015 -20% Services 2,076 1,474 41% Energy Production 220 222 -1% Total Cost of Sales 3,915 3,711 5% Gross Profit 2,834 2,703 5% Net loss (780)$ (856)$ Gross Margin Products 34% 33% Services 47% 52% Energy Production 37% 37% Overall 42% 42% QTD Gross Margin 2023 2022 Target Overall 42% 42% >40%
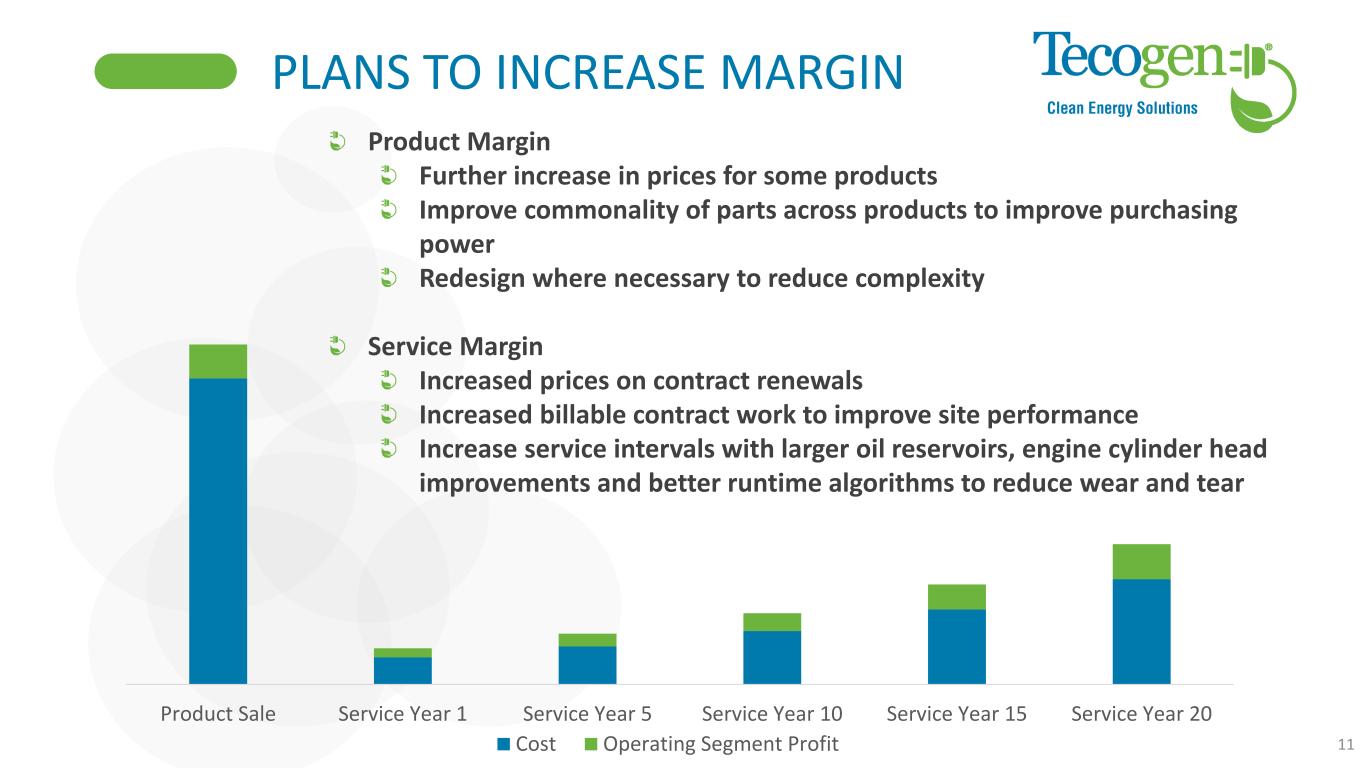
PLANS TO INCREASE MARGIN 11 Product Sale Service Year 1 Service Year 5 Service Year 10 Service Year 15 Service Year 20 Cost Operating Segment Profit Product Margin Further increase in prices for some products Improve commonality of parts across products to improve purchasing power Redesign where necessary to reduce complexity Service Margin Increased prices on contract renewals Increased billable contract work to improve site performance Increase service intervals with larger oil reservoirs, engine cylinder head improvements and better runtime algorithms to reduce wear and tear
Priorities SUMMARY AND Q&A Company Information Tecogen Inc. 45 First Ave Waltham, MA 02451 www.Tecogen.com Contact information Abinand Rangesh, CEO 781.466.6487 Abinand.rangesh@Tecogen.com 12 ✓ Cashflow ✓ Grow revenue and backlog ✓ Increase margin for both Services and Products