OTCQX: TGEN SIDOTI CONFERENCE JANUARY 17TH 2024 1
SAFE HARBOR STATEMENT This presentation and accompanying documents contain “forward-looking statements” which may describe strategies, goals, outlooks or other non- historical matters, or projected revenues, Income, returns or other financial measures, that may include words such as "believe," "expect," "anticipate," "intend," "plan," "estimate," "project," "target," "potential," "will," "should," "could," "likely," or "may" and similar expressions intended to identify forward-looking statements. These statements are only predictions and involve known and unknown risks, uncertainties, and other factors that may cause our actual results to differ materially from those expressed or implied by such forward-looking statements. Given these uncertainties, you should not place undue reliance on these forward-looking statements. Forward-looking statements speak only as of the date on which they are made, and we undertake no obligation to update or revise any forward-looking statements. In addition to those factors described in our Annual Report on Form 10-K and our Quarterly Reports on Form 10-Q under “Risk Factors”, among the factors that could cause actual results to differ materially from past and projected future results are the following: fluctuations in demand for our products and services, competing technological developments, issues relating to research and development, the availability of incentives, rebates, and tax benefits relating to our products and services, changes in the regulatory environment relating to our products and services, integration of acquired business operations, and the ability to obtain financing on favorable terms to fund existing operations and anticipated growth. In addition to GAAP financial measures, this presentation includes certain non-GAAP financial measures, including adjusted EBITDA which excludes certain expenses as described in the presentation. We use Adjusted EBITDA as an internal measure of business operating performance and believe that the presentation of non-GAAP financial measures provides a meaningful perspective of the underlying operating performance of our current business and enables investors to better understand and evaluate our historical and prospective operating performance by eliminating items that vary from period to period without correlation to our core operating performance and highlights trends in our business that may not otherwise be apparent when relying solely on GAAP financial measures. 2
AGENDA Overview of the Business Products Markets Competitive Advantage Strategic Plan for Growth Growing Recurring Revenue Growing Margin with Operational Improvements, Self Learning Control & Utility Value Stack Growing Product Revenue with Cooling as A Service 3
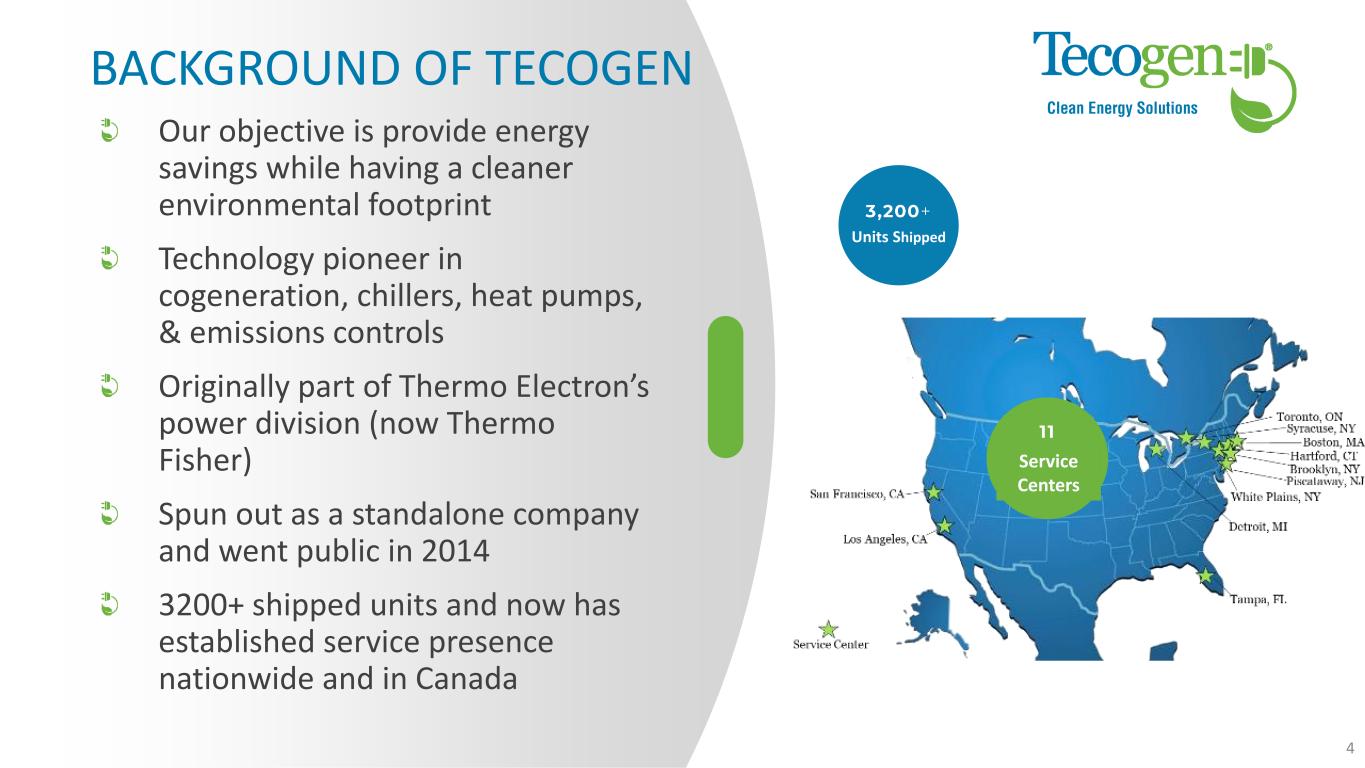
4 Units Shipped Service Centers Our objective is provide energy savings while having a cleaner environmental footprint Technology pioneer in cogeneration, chillers, heat pumps, & emissions controls Originally part of Thermo Electron’s power division (now Thermo Fisher) Spun out as a standalone company and went public in 2014 3200+ shipped units and now has established service presence nationwide and in Canada BACKGROUND OF TECOGEN
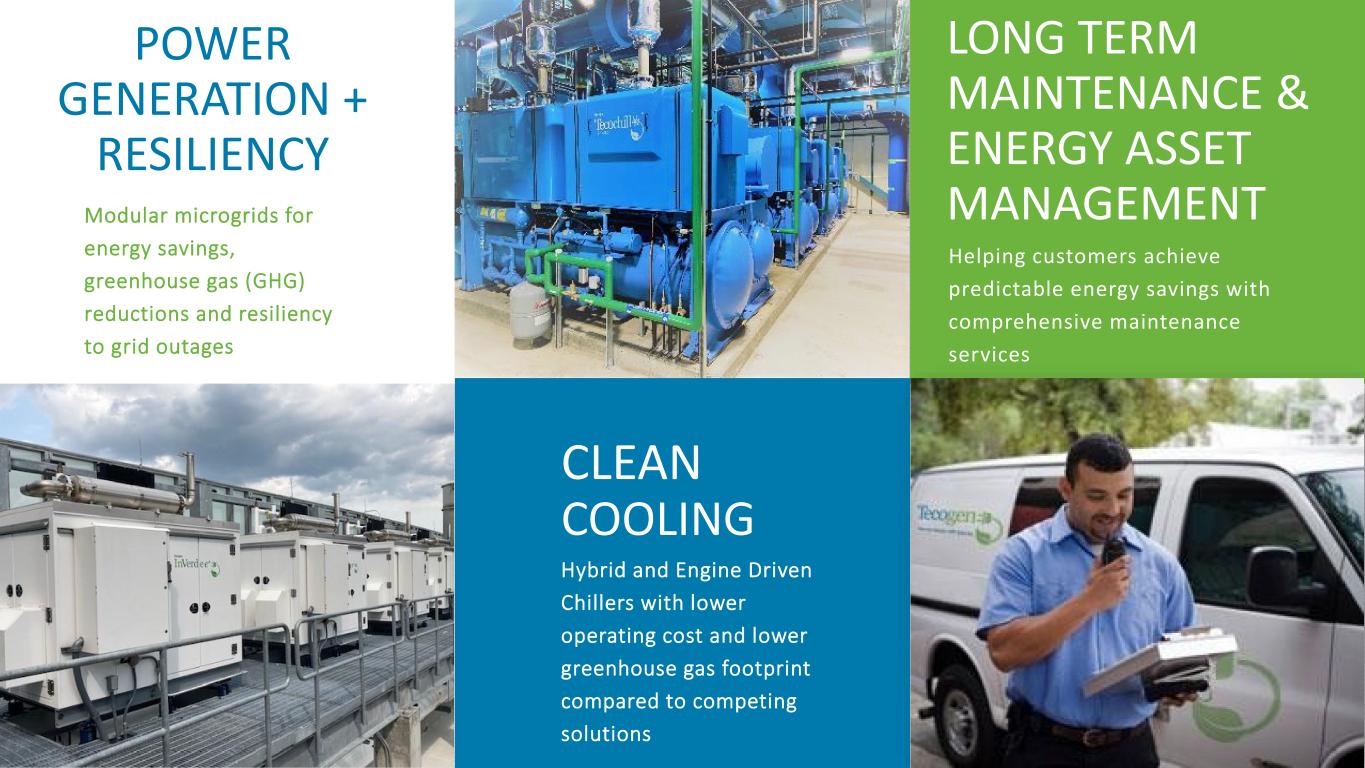
POWER GENERATION + RESILIENCY CLEAN COOLING Hybrid and Engine Driven Chillers with lower operating cost and lower greenhouse gas footprint compared to competing solutions LONG TERM MAINTENANCE & ENERGY ASSET MANAGEMENTModular microgrids for energy savings, greenhouse gas (GHG) reductions and resiliency to grid outages Helping customers achieve predictable energy savings with comprehensive maintenance services
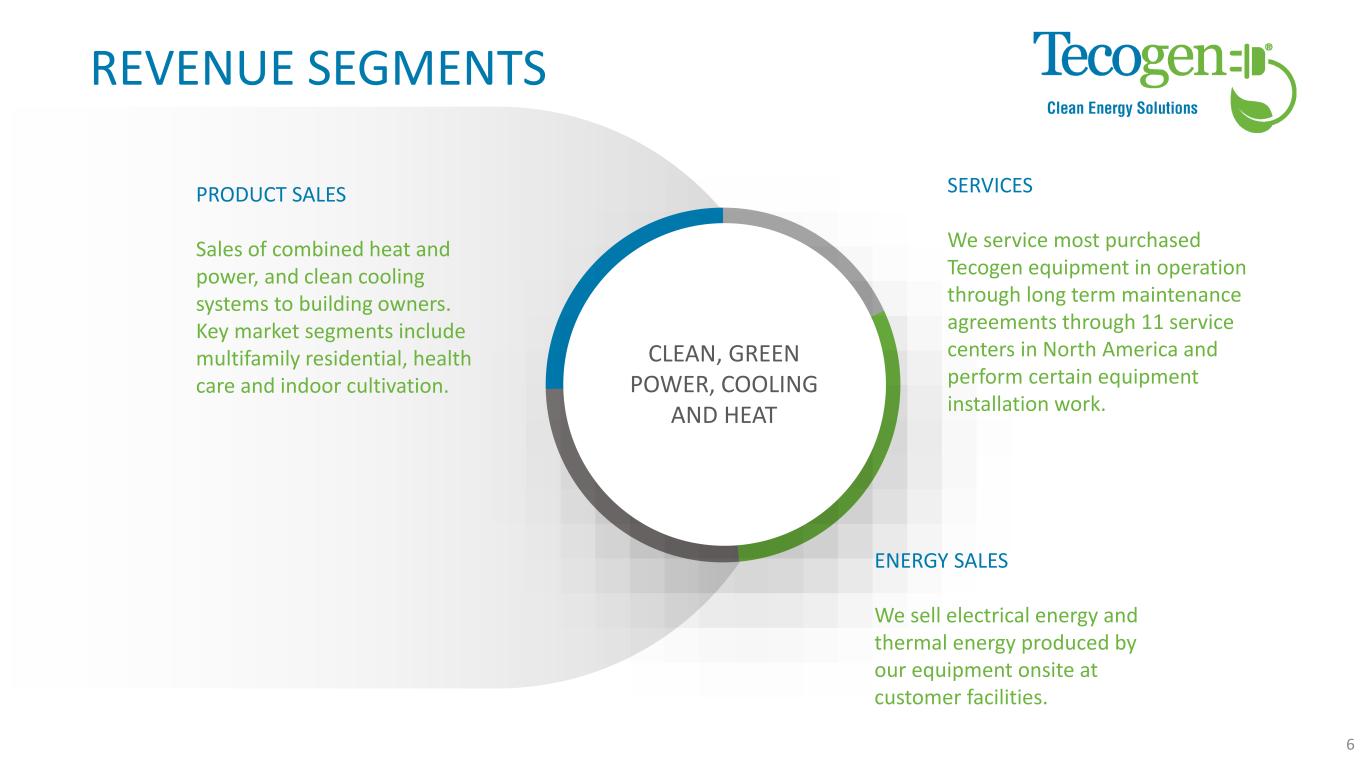
REVENUE SEGMENTS We service most purchased Tecogen equipment in operation through long term maintenance agreements through 11 service centers in North America and perform certain equipment installation work. SERVICES CLEAN, GREEN POWER, COOLING AND HEAT Sales of combined heat and power, and clean cooling systems to building owners. Key market segments include multifamily residential, health care and indoor cultivation. PRODUCT SALES We sell electrical energy and thermal energy produced by our equipment onsite at customer facilities. ENERGY SALES 6
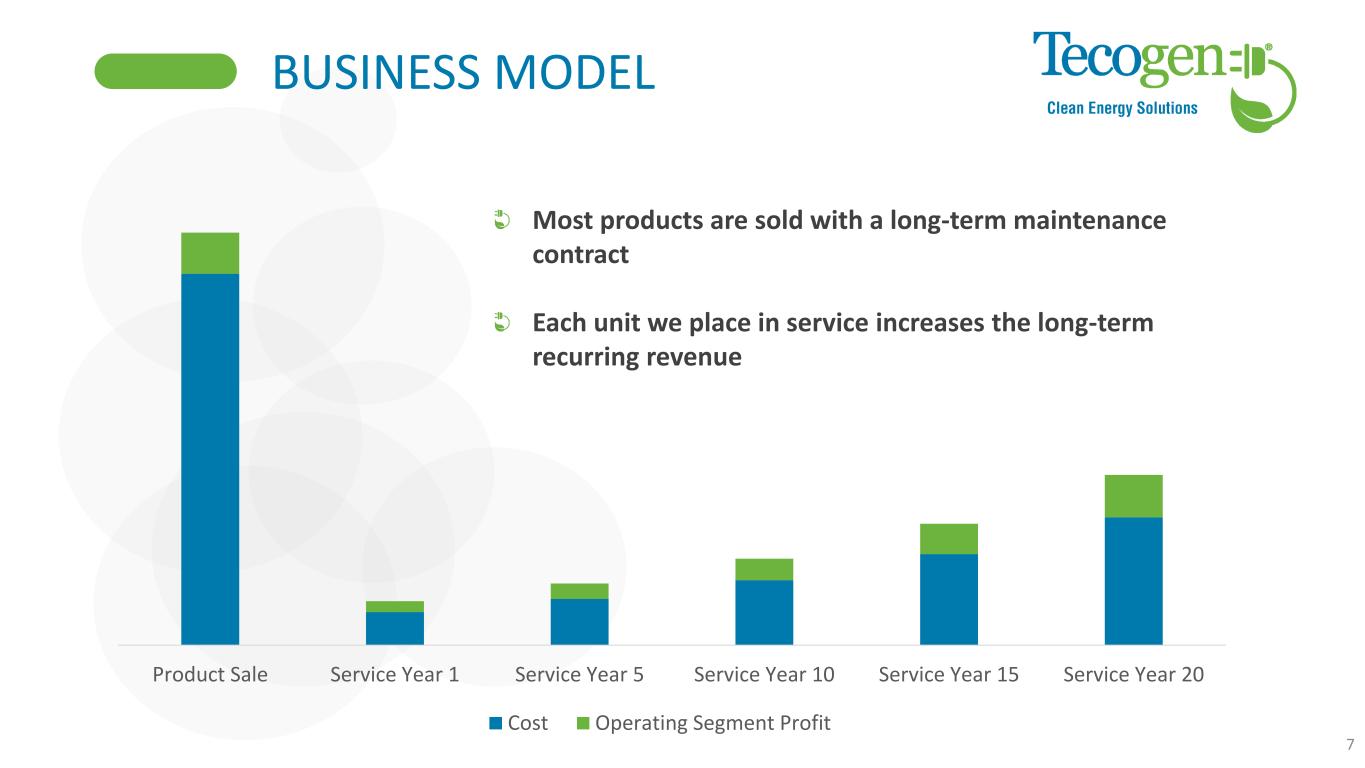
BUSINESS MODEL 7 Product Sale Service Year 1 Service Year 5 Service Year 10 Service Year 15 Service Year 20 Cost Operating Segment Profit Most products are sold with a long-term maintenance contract Each unit we place in service increases the long-term recurring revenue
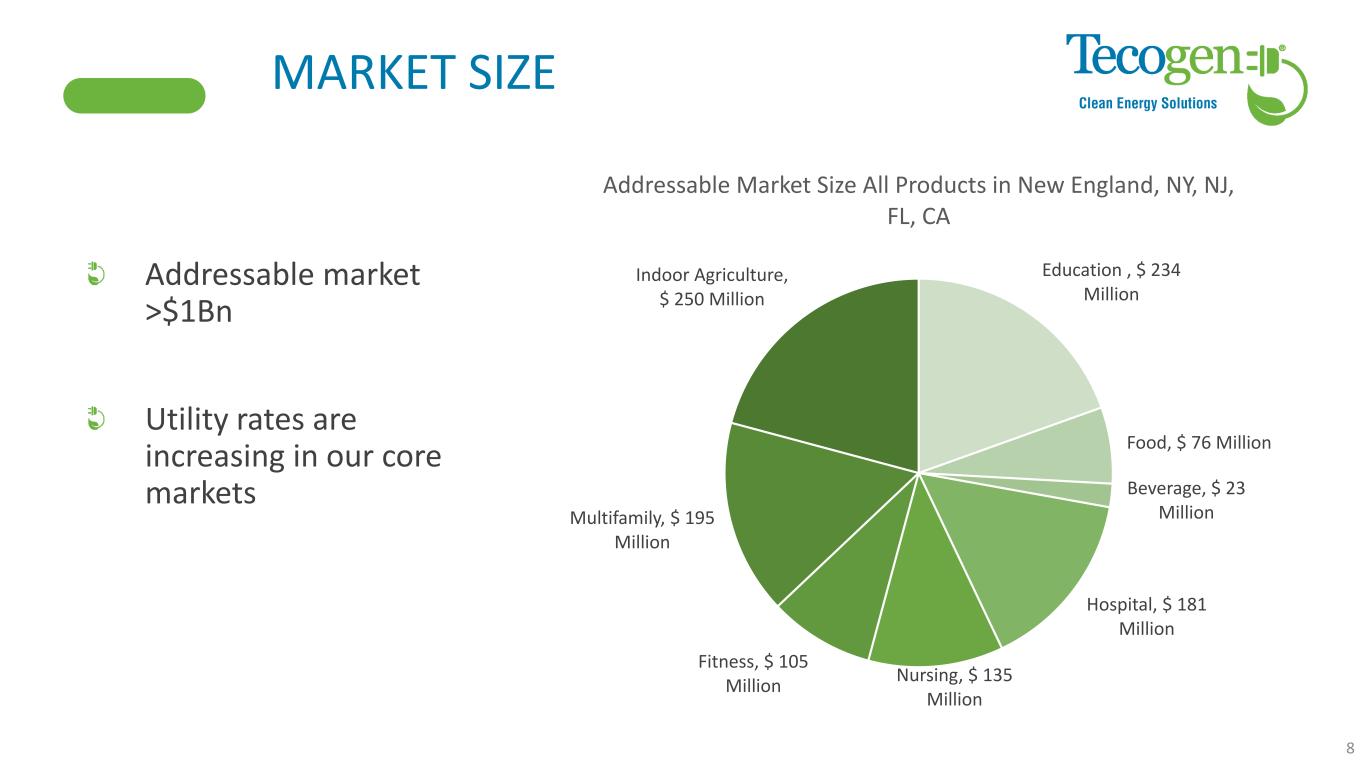
Addressable market >$1Bn Utility rates are increasing in our core markets 8 Education , $ 234 Million Food, $ 76 Million Beverage, $ 23 Million Hospital, $ 181 Million Nursing, $ 135 Million Fitness, $ 105 Million Multifamily, $ 195 Million Indoor Agriculture, $ 250 Million Addressable Market Size All Products in New England, NY, NJ, FL, CA MARKET SIZE
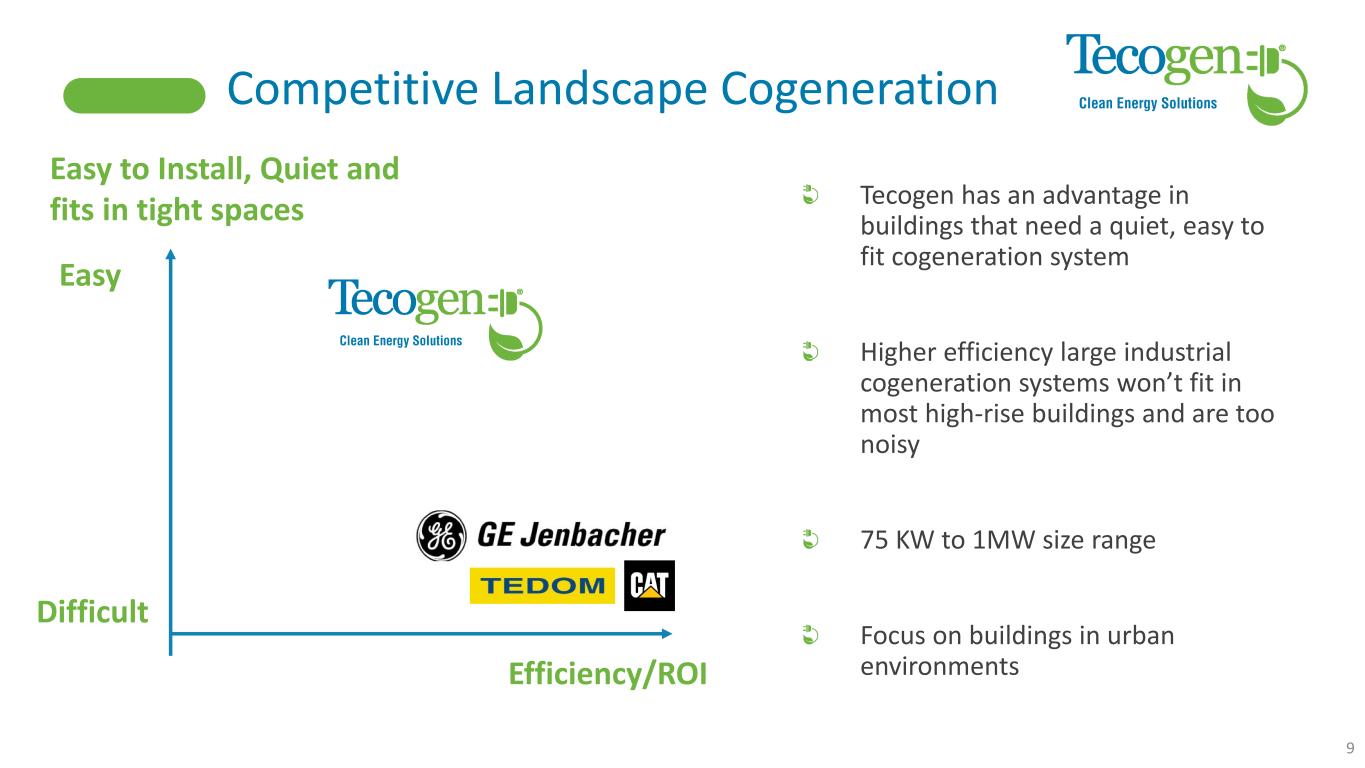
Competitive Landscape Cogeneration Easy to Install, Quiet and fits in tight spaces Efficiency/ROI Easy Difficult Tecogen has an advantage in buildings that need a quiet, easy to fit cogeneration system Higher efficiency large industrial cogeneration systems won’t fit in most high-rise buildings and are too noisy 75 KW to 1MW size range Focus on buildings in urban environments 9
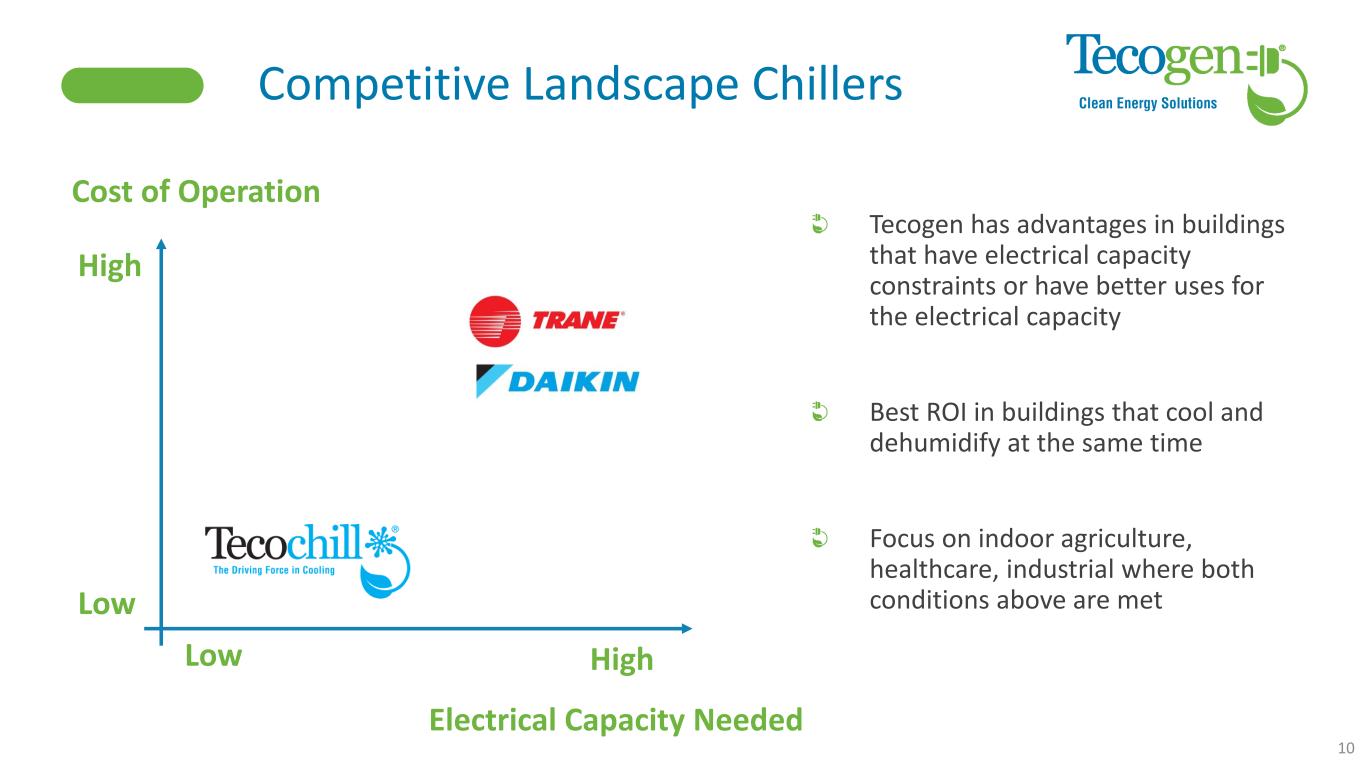
Competitive Landscape Chillers Cost of Operation Electrical Capacity Needed High Low High Low Tecogen has advantages in buildings that have electrical capacity constraints or have better uses for the electrical capacity Best ROI in buildings that cool and dehumidify at the same time Focus on indoor agriculture, healthcare, industrial where both conditions above are met 10
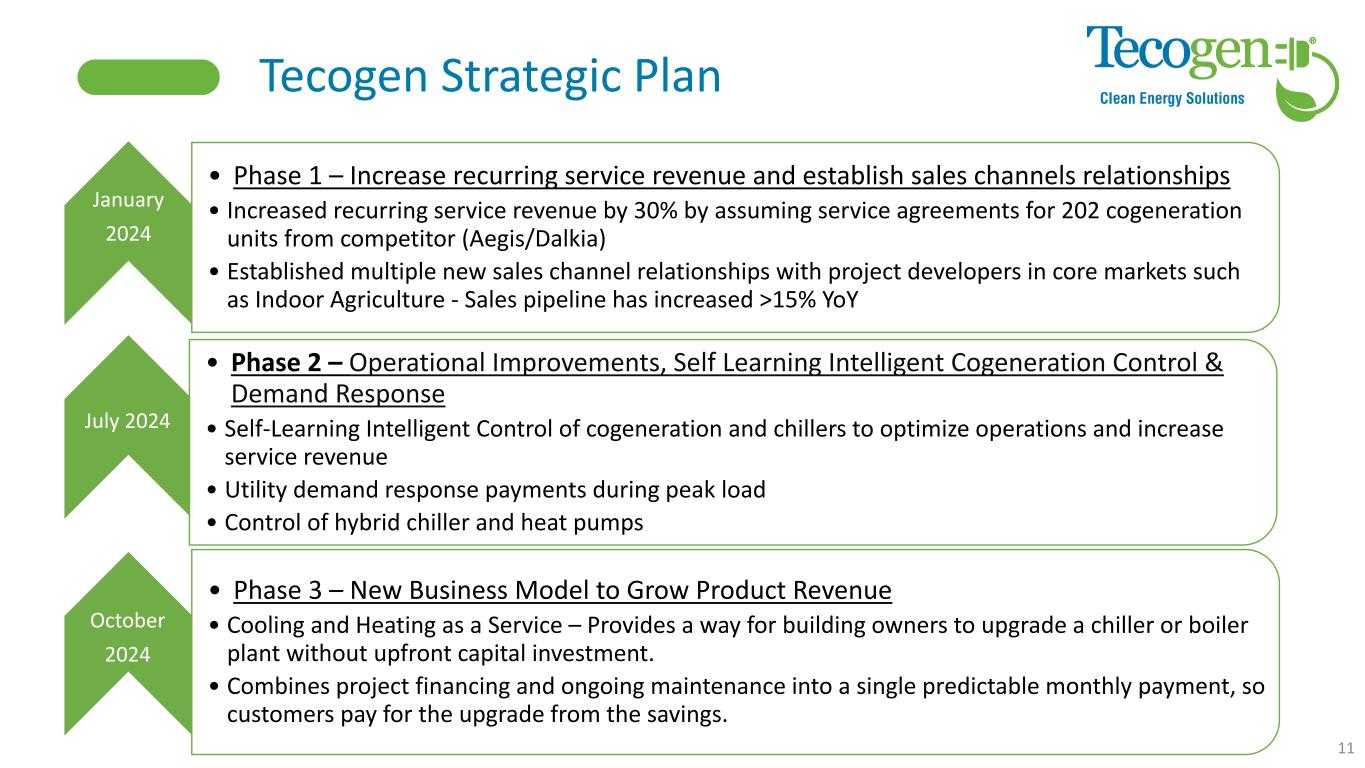
Tecogen Strategic Plan • Phase 1 – Increase recurring service revenue and establish sales channels relationships • Increased recurring service revenue by 30% by assuming service agreements for 202 cogeneration units from competitor (Aegis/Dalkia) • Established multiple new sales channel relationships with project developers in core markets such as Indoor Agriculture - Sales pipeline has increased >15% YoY • Phase 2 – Operational Improvements, Self Learning Intelligent Cogeneration Control & Demand Response • Self-Learning Intelligent Control of cogeneration and chillers to optimize operations and increase service revenue • Utility demand response payments during peak load • Control of hybrid chiller and heat pumps • Phase 3 – New Business Model to Grow Product Revenue • Cooling and Heating as a Service – Provides a way for building owners to upgrade a chiller or boiler plant without upfront capital investment. • Combines project financing and ongoing maintenance into a single predictable monthly payment, so customers pay for the upgrade from the savings. 11 January 2024 July 2024 October 2024
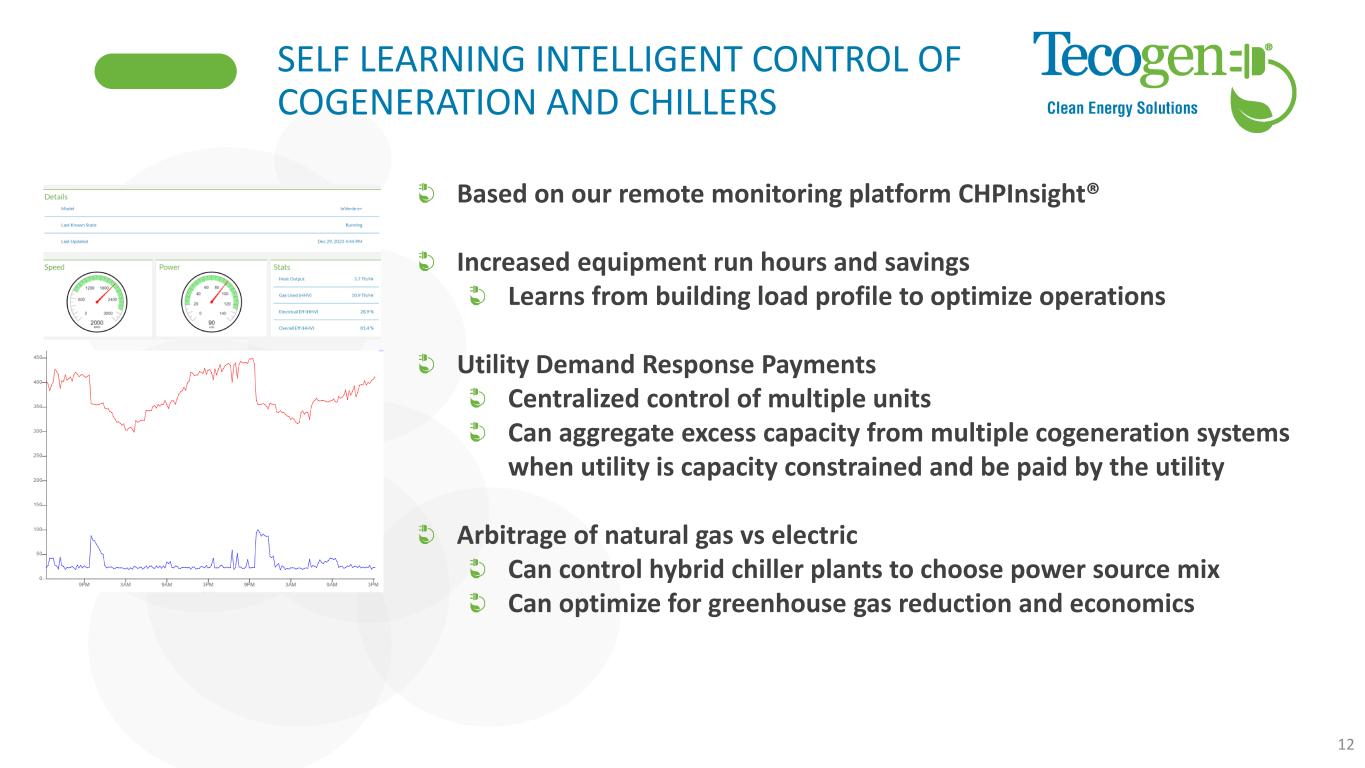
SELF LEARNING INTELLIGENT CONTROL OF COGENERATION AND CHILLERS 12 Based on our remote monitoring platform CHPInsight® Increased equipment run hours and savings Learns from building load profile to optimize operations Utility Demand Response Payments Centralized control of multiple units Can aggregate excess capacity from multiple cogeneration systems when utility is capacity constrained and be paid by the utility Arbitrage of natural gas vs electric Can control hybrid chiller plants to choose power source mix Can optimize for greenhouse gas reduction and economics
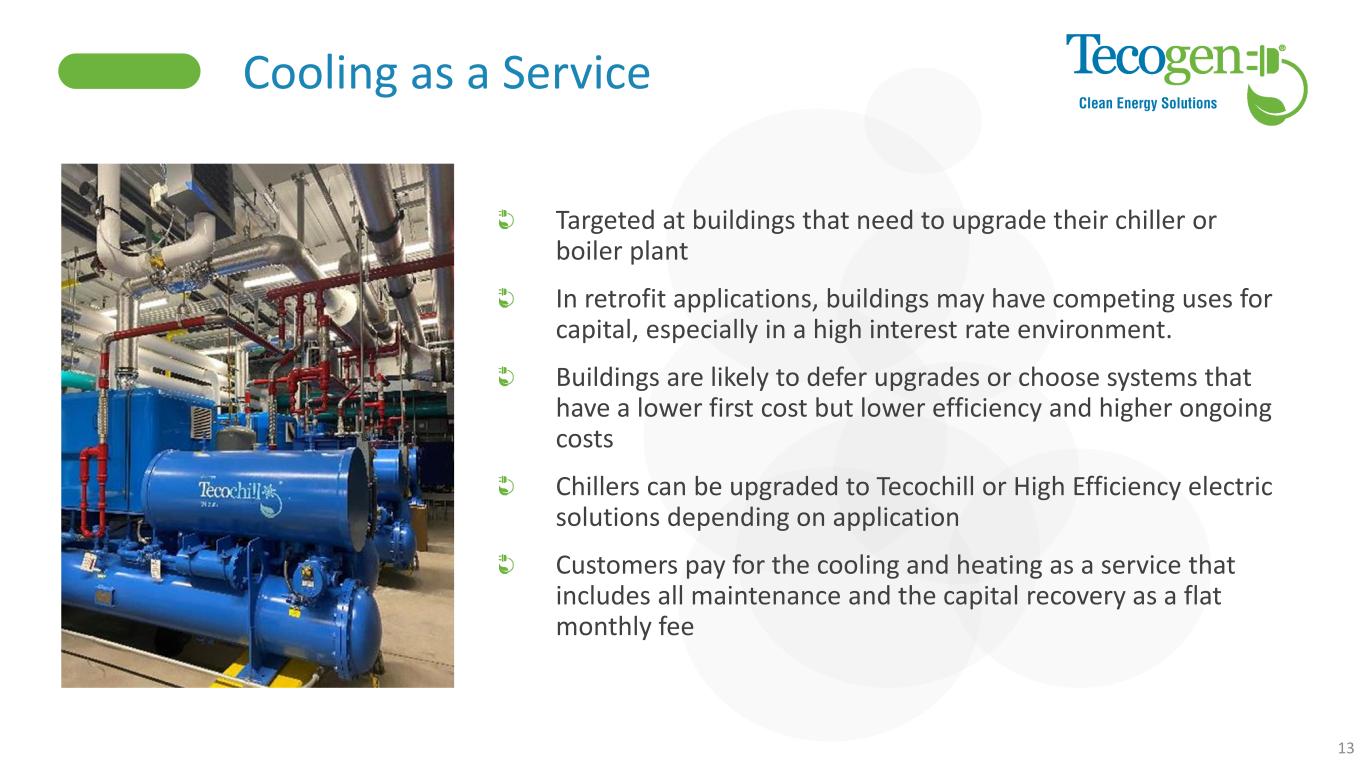
Cooling as a Service 13 Targeted at buildings that need to upgrade their chiller or boiler plant In retrofit applications, buildings may have competing uses for capital, especially in a high interest rate environment. Buildings are likely to defer upgrades or choose systems that have a lower first cost but lower efficiency and higher ongoing costs Chillers can be upgraded to Tecochill or High Efficiency electric solutions depending on application Customers pay for the cooling and heating as a service that includes all maintenance and the capital recovery as a flat monthly fee
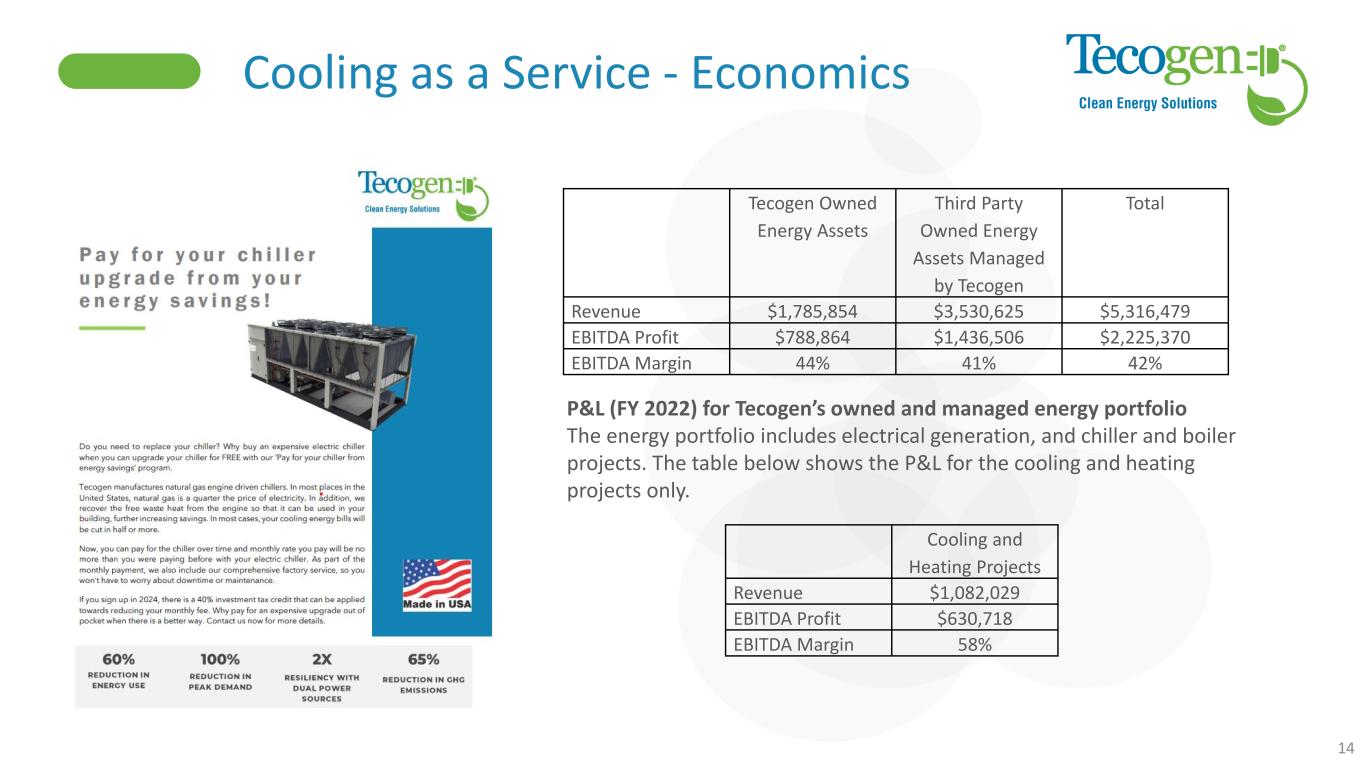
Cooling as a Service - Economics 14 Tecogen Owned Energy Assets Third Party Owned Energy Assets Managed by Tecogen Total Revenue $1,785,854 $3,530,625 $5,316,479 EBITDA Profit $788,864 $1,436,506 $2,225,370 EBITDA Margin 44% 41% 42% Cooling and Heating Projects Revenue $1,082,029 EBITDA Profit $630,718 EBITDA Margin 58% P&L (FY 2022) for Tecogen’s owned and managed energy portfolio The energy portfolio includes electrical generation, and chiller and boiler projects. The table below shows the P&L for the cooling and heating projects only.
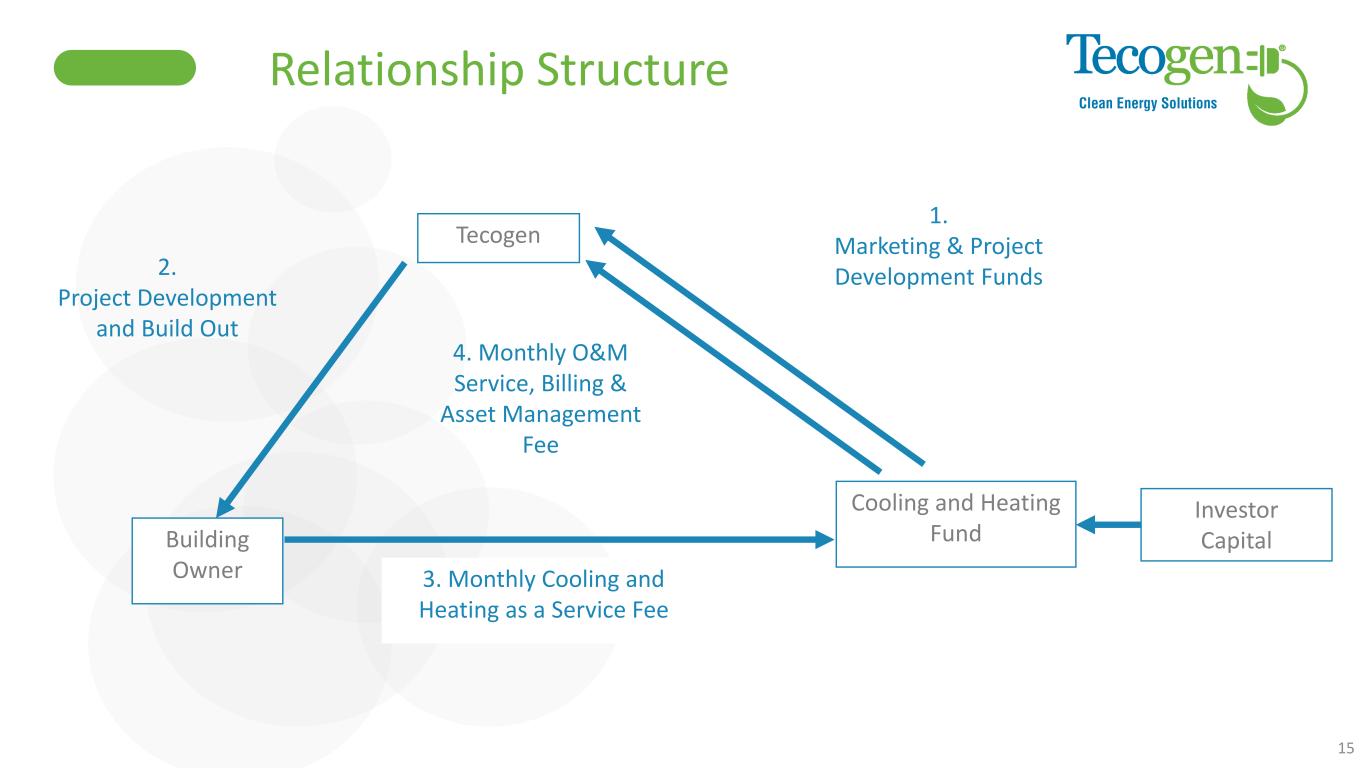
15 Relationship Structure Tecogen Cooling and Heating FundBuilding Owner 1. Marketing & Project Development Funds 3. Monthly Cooling and Heating as a Service Fee 4. Monthly O&M Service, Billing & Asset Management Fee 2. Project Development and Build Out Investor Capital
SUMMARY AND Q&A Company Information Tecogen, Inc 45 First Ave Waltham, MA 02451 www.Tecogen.com Contact information Abinand Rangesh, CEO 781.466.6487 Abinand.rangesh@Tecogen.com 16 Tecogen is at a turning point Increased recurring Revenue from service acquisitions Exciting product pipeline including hybrid chiller, Self- learning intelligent control and optimization of cogeneration and chiller plants Long term value with control of large number of cogeneration assets in peak priced utility regions Reduced barriers to product growth with cooling as a service