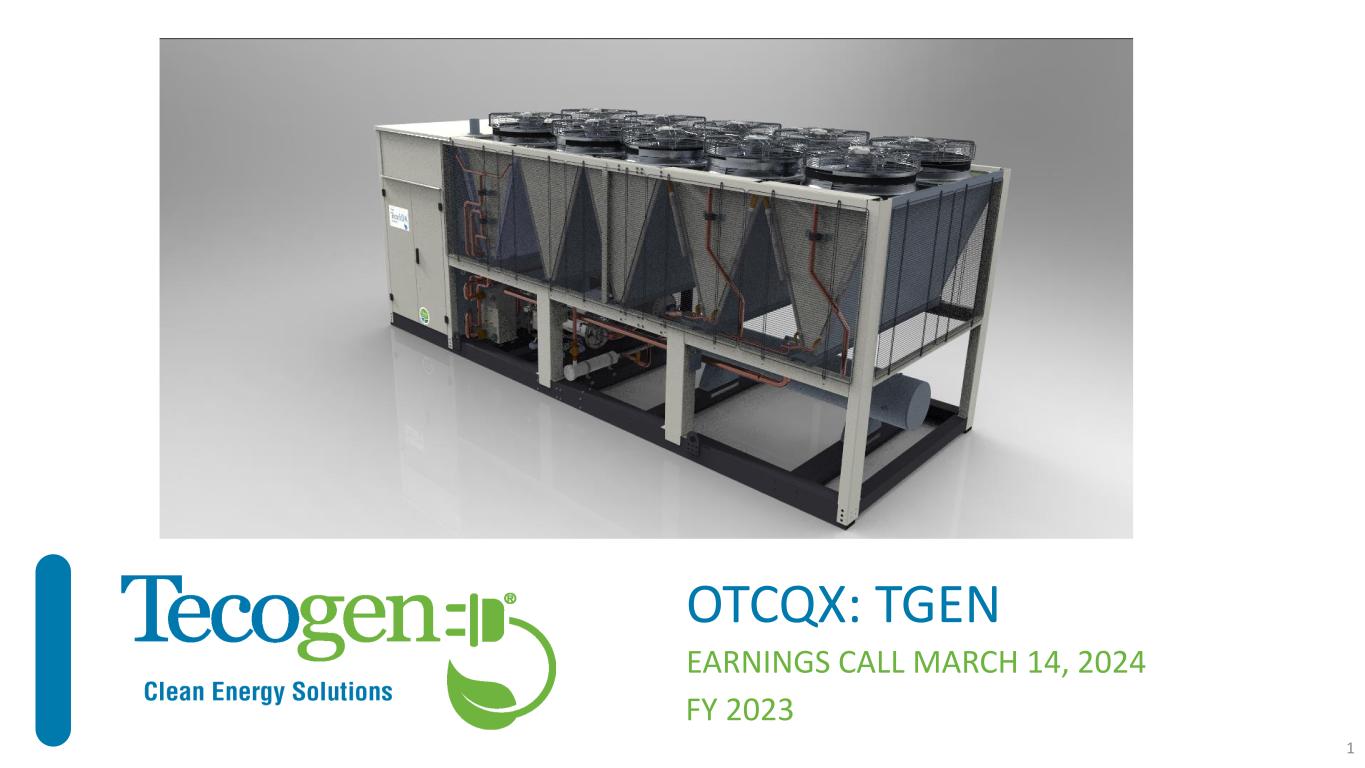
OTCQX: TGEN FY 2023 EARNINGS CALL MARCH 14, 2024 1
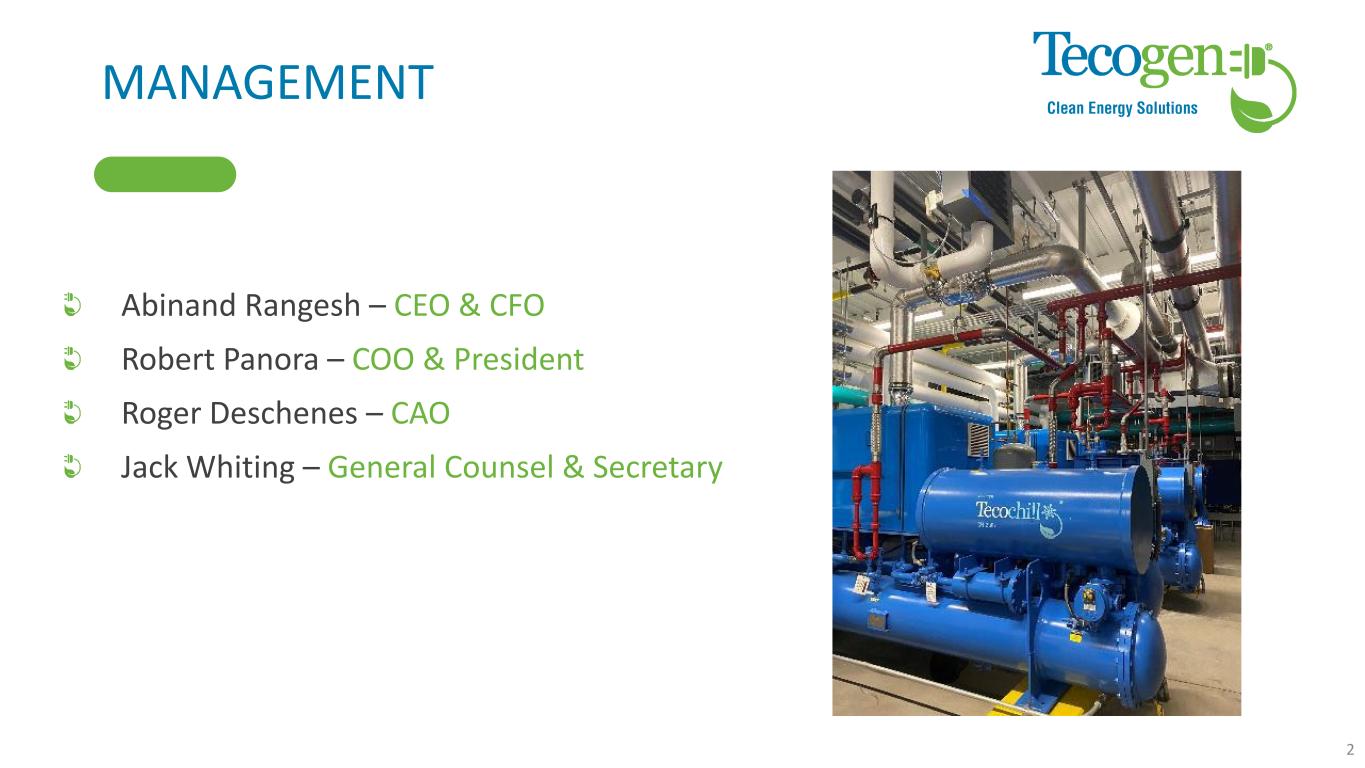
MANAGEMENT Abinand Rangesh – CEO & CFO Robert Panora – COO & President Roger Deschenes – CAO Jack Whiting – General Counsel & Secretary 2
SAFE HARBOR STATEMENT This presentation and accompanying documents contain “forward-looking statements” which may describe strategies, goals, outlooks or other non- historical matters, or projected revenues, Income, returns or other financial measures, that may include words such as "believe," "expect," "anticipate," "intend," "plan," "estimate," "project," "target," "potential," "will," "should," "could," "likely," or "may" and similar expressions intended to identify forward-looking statements. These statements are only predictions and involve known and unknown risks, uncertainties, and other factors that may cause our actual results to differ materially from those expressed or implied by such forward-looking statements. Given these uncertainties, you should not place undue reliance on these forward-looking statements. Forward-looking statements speak only as of the date on which they are made, and we undertake no obligation to update or revise any forward-looking statements. In addition to those factors described in our Annual Report on Form 10-K and our Quarterly Reports on Form 10-Q under “Risk Factors”, among the factors that could cause actual results to differ materially from past and projected future results are the following: fluctuations in demand for our products and services, competing technological developments, issues relating to research and development, the availability of incentives, rebates, and tax benefits relating to our products and services, changes in the regulatory environment relating to our products and services, integration of acquired business operations, and the ability to obtain financing on favorable terms to fund existing operations and anticipated growth. In addition to GAAP financial measures, this presentation includes certain non-GAAP financial measures, including adjusted EBITDA which excludes certain expenses as described in the presentation. We use Adjusted EBITDA as an internal measure of business operating performance and believe that the presentation of non-GAAP financial measures provides a meaningful perspective of the underlying operating performance of our current business and enables investors to better understand and evaluate our historical and prospective operating performance by eliminating items that vary from period to period without correlation to our core operating performance and highlights trends in our business that may not otherwise be apparent when relying solely on GAAP financial measures. 3
AGENDA Key Takeaways 2023 • Market Changes • Strategy – What was achieved • Strategy – What remains to be achieved 4Q 2023 Results FY 2023 Results 2024 Plan Q&A 4
MARKET CHANGES 2023 5 Headwind - Significant anti-gas sentiment in NY, MA, CA • NYC projects, especially in low-income housing cancelled due to anti-gas sentiment • Pivoted business to target gas friendly geographies nationwide Increasing Tailwind - Electrical capacity constraints, and expensive time of day charges, especially for larger facilities
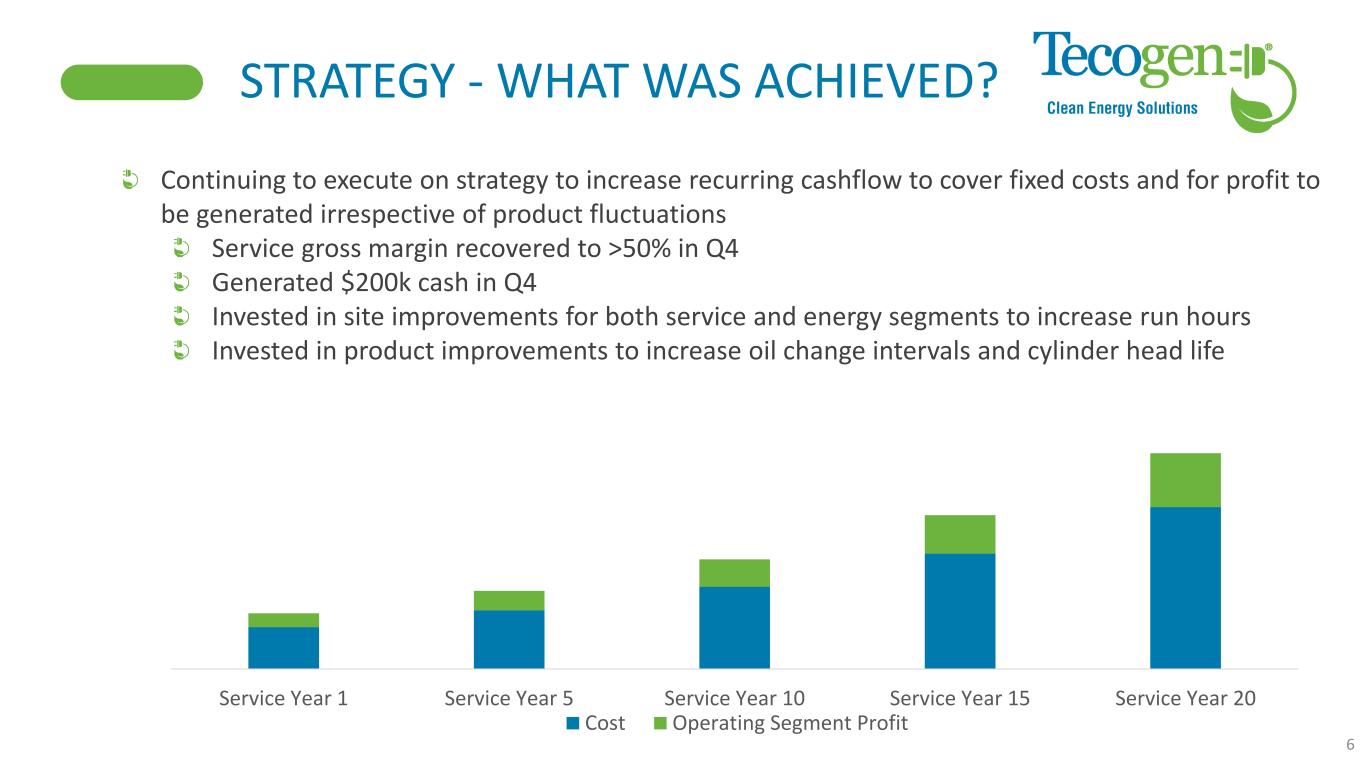
STRATEGY - WHAT WAS ACHIEVED? 6 Service Year 1 Service Year 5 Service Year 10 Service Year 15 Service Year 20 Cost Operating Segment Profit Continuing to execute on strategy to increase recurring cashflow to cover fixed costs and for profit to be generated irrespective of product fluctuations Service gross margin recovered to >50% in Q4 Generated $200k cash in Q4 Invested in site improvements for both service and energy segments to increase run hours Invested in product improvements to increase oil change intervals and cylinder head life
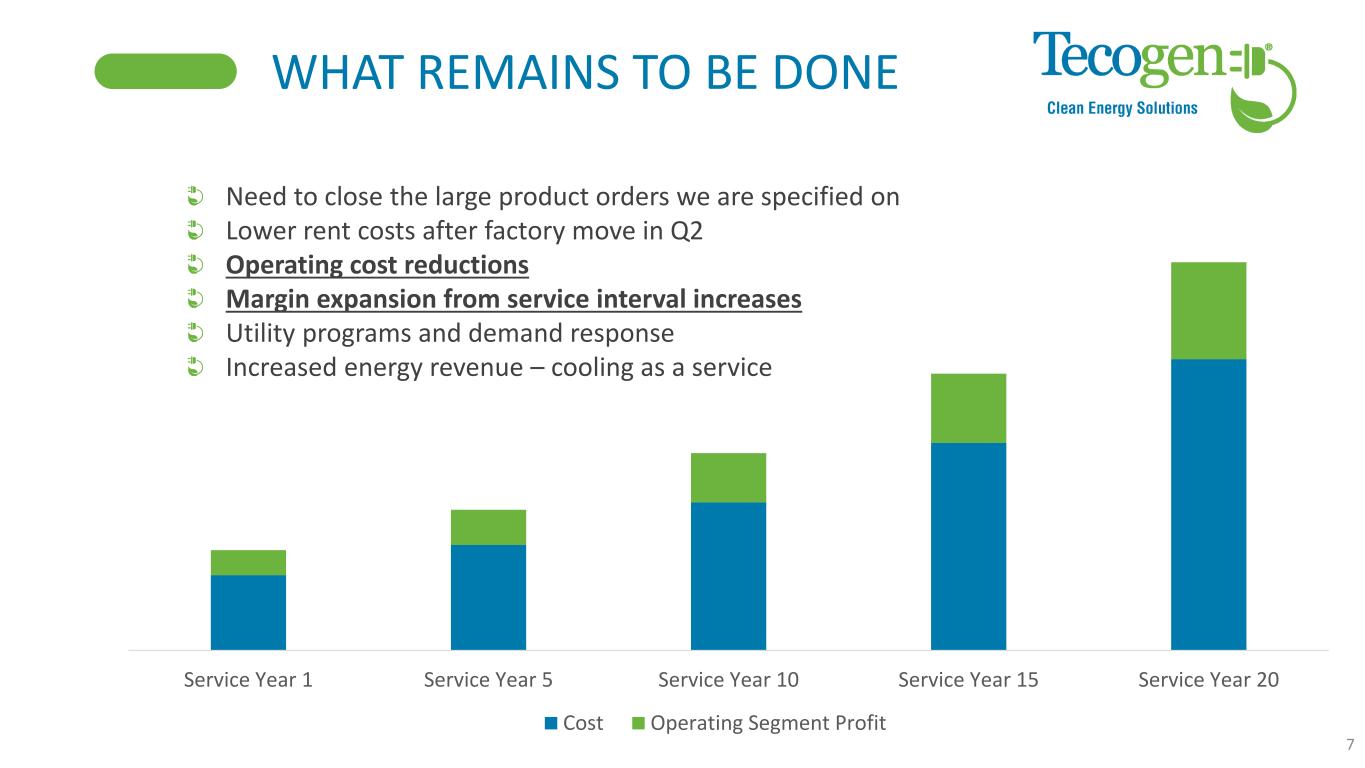
WHAT REMAINS TO BE DONE 7 Service Year 1 Service Year 5 Service Year 10 Service Year 15 Service Year 20 Cost Operating Segment Profit Need to close the large product orders we are specified on Lower rent costs after factory move in Q2 Operating cost reductions Margin expansion from service interval increases Utility programs and demand response Increased energy revenue – cooling as a service
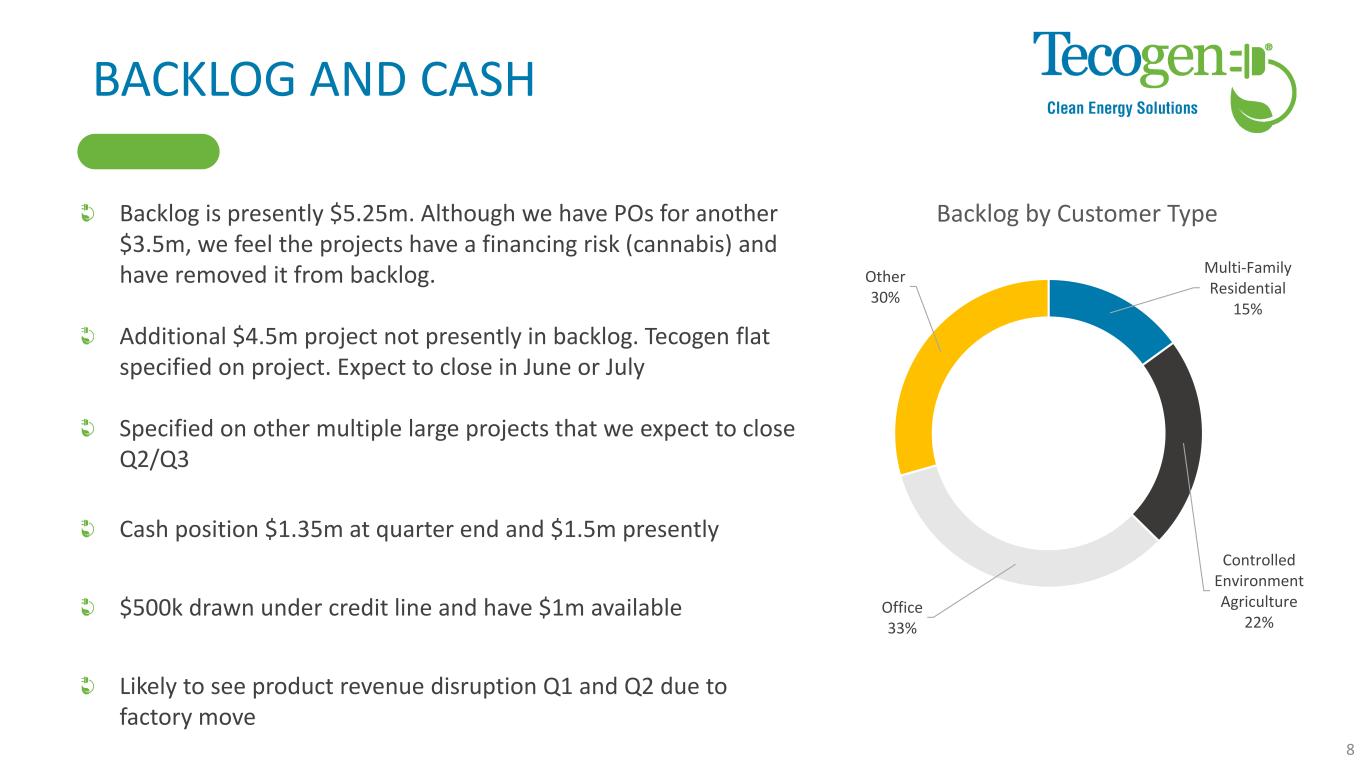
BACKLOG AND CASH Backlog is presently $5.25m. Although we have POs for another $3.5m, we feel the projects have a financing risk (cannabis) and have removed it from backlog. Additional $4.5m project not presently in backlog. Tecogen flat specified on project. Expect to close in June or July Specified on other multiple large projects that we expect to close Q2/Q3 Cash position $1.35m at quarter end and $1.5m presently $500k drawn under credit line and have $1m available Likely to see product revenue disruption Q1 and Q2 due to factory move Multi-Family Residential 15% Controlled Environment Agriculture 22% Office 33% Other 30% Backlog by Customer Type 8
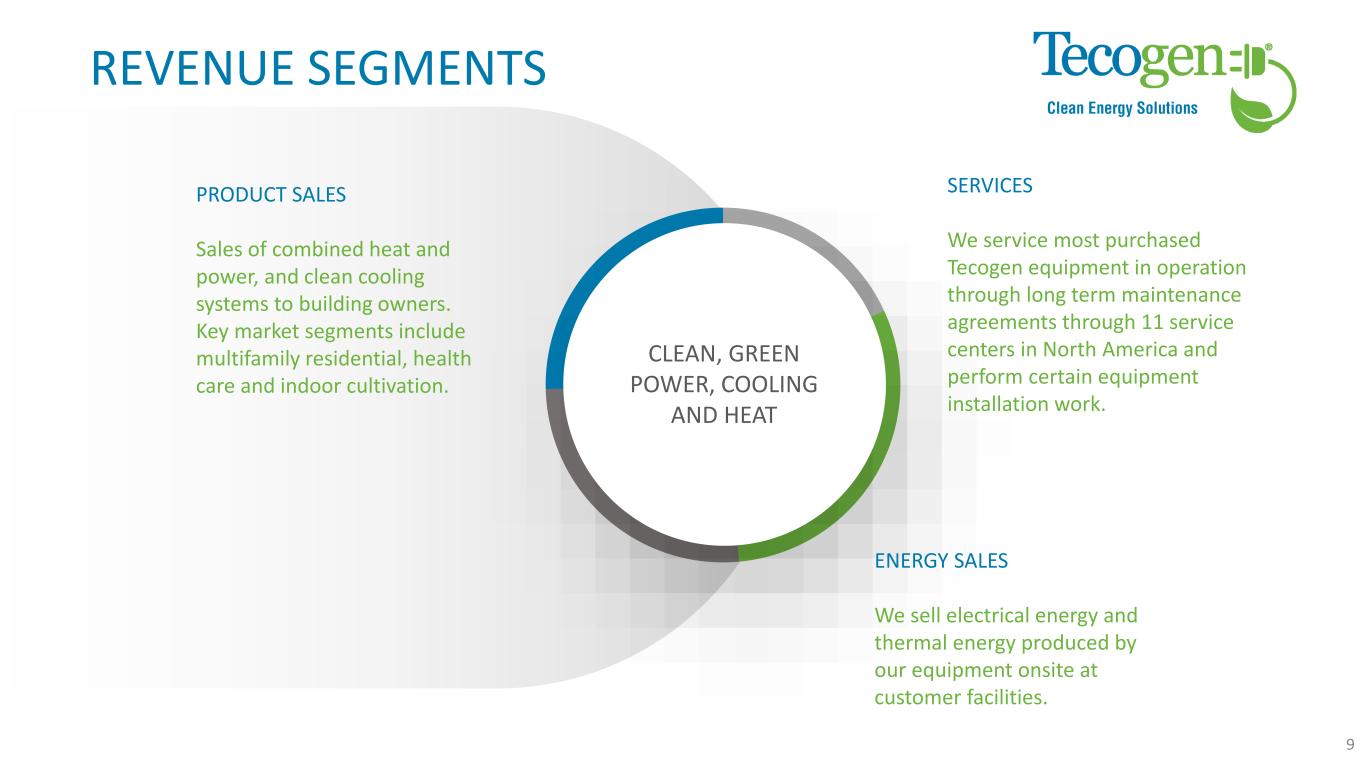
REVENUE SEGMENTS We service most purchased Tecogen equipment in operation through long term maintenance agreements through 11 service centers in North America and perform certain equipment installation work. SERVICES CLEAN, GREEN POWER, COOLING AND HEAT Sales of combined heat and power, and clean cooling systems to building owners. Key market segments include multifamily residential, health care and indoor cultivation. PRODUCT SALES We sell electrical energy and thermal energy produced by our equipment onsite at customer facilities. ENERGY SALES 9
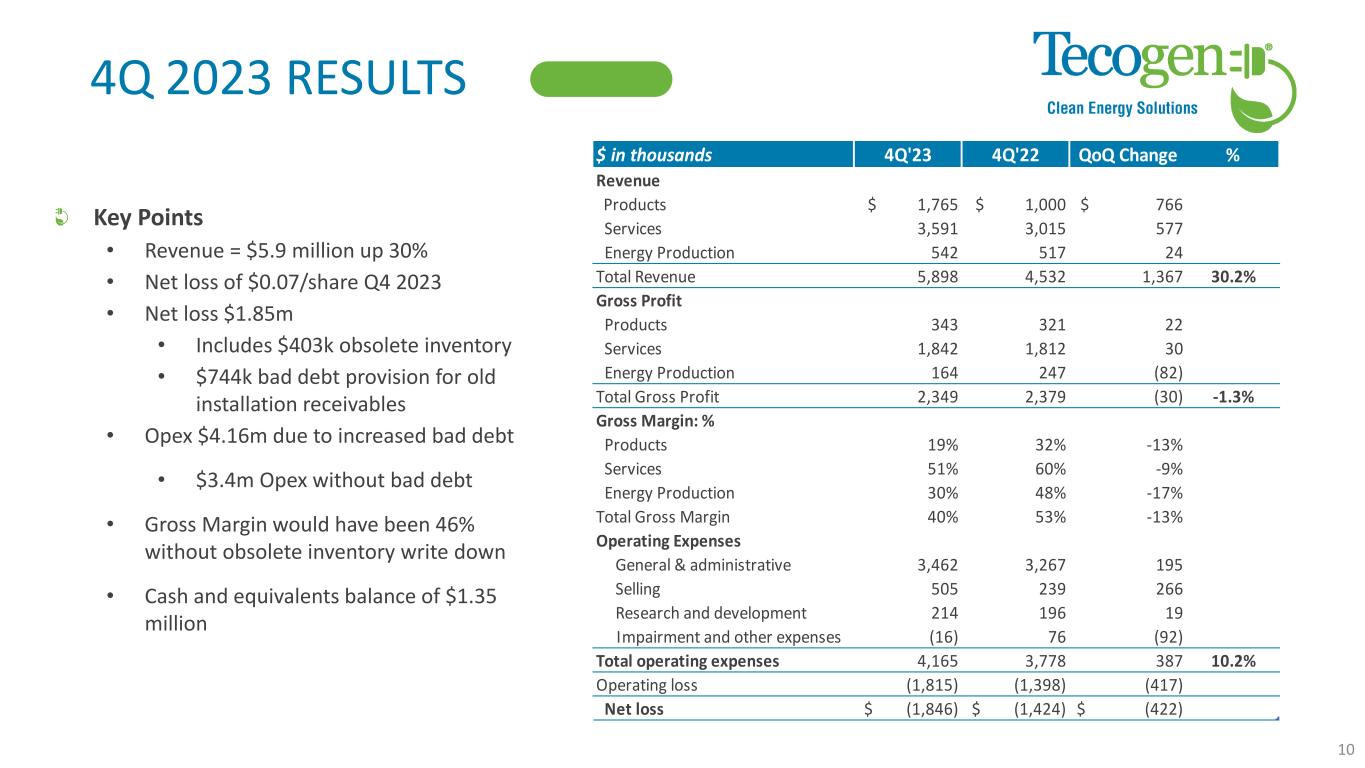
4Q 2023 RESULTS Key Points • Revenue = $5.9 million up 30% • Net loss of $0.07/share Q4 2023 • Net loss $1.85m • Includes $403k obsolete inventory • $744k bad debt provision for old installation receivables • Opex $4.16m due to increased bad debt • $3.4m Opex without bad debt • Gross Margin would have been 46% without obsolete inventory write down • Cash and equivalents balance of $1.35 million 10 $ in thousands 4Q'23 4Q'22 QoQ Change % Revenue Products $ 1,765 $ 1,000 $ 766 Services 3,591 3,015 577 Energy Production 542 517 24 Total Revenue 5,898 4,532 1,367 30.2% Gross Profit Products 343 321 22 Services 1,842 1,812 30 Energy Production 164 247 (82) Total Gross Profit 2,349 2,379 (30) -1.3% Gross Margin: % Products 19% 32% -13% Services 51% 60% -9% Energy Production 30% 48% -17% Total Gross Margin 40% 53% -13% Operating Expenses General & administrative 3,462 3,267 195 Selling 505 239 266 Research and development 214 196 19 Impairment and other expenses (16) 76 (92) Total operating expenses 4,165 3,778 387 10.2% Operating loss (1,815) (1,398) (417) 29.8% Net loss $ (1,846) $ (1,424) $ (422) 29.6%
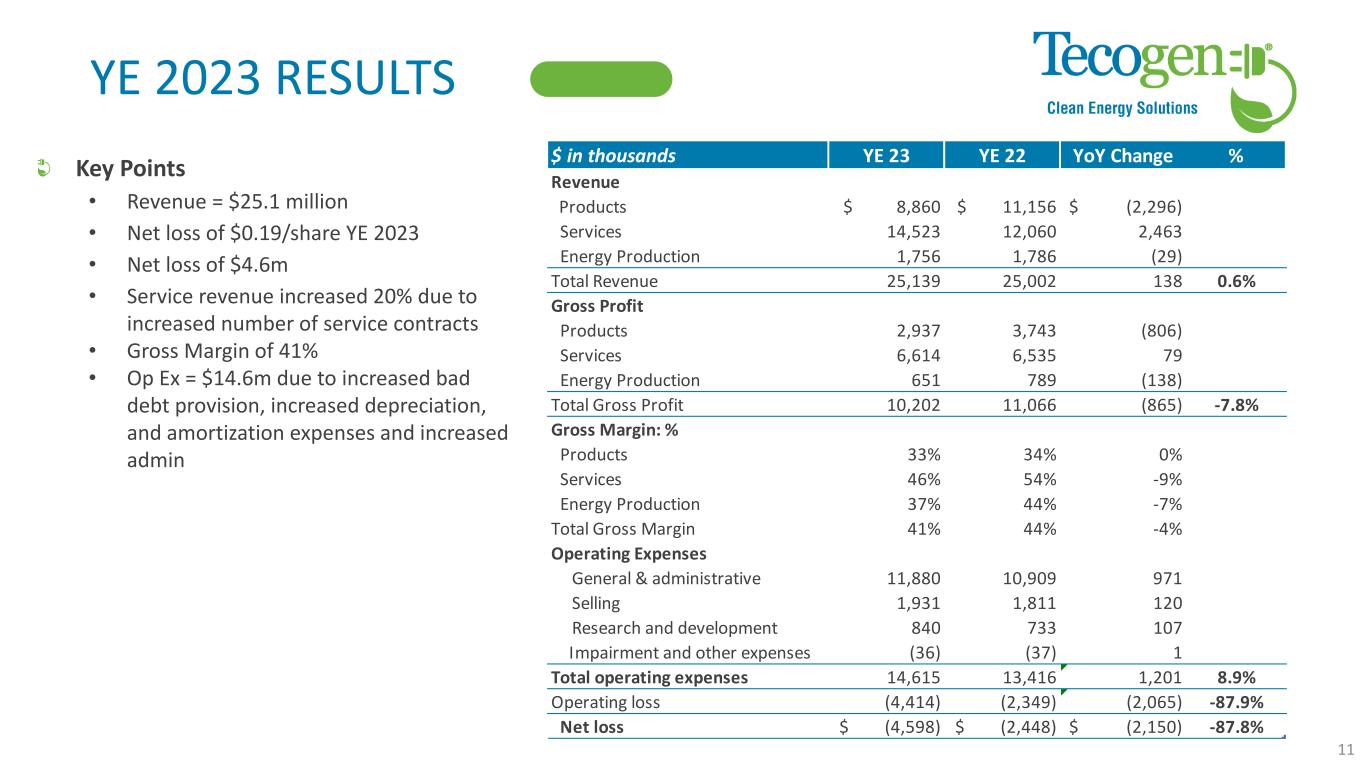
YE 2023 RESULTS Key Points • Revenue = $25.1 million • Net loss of $0.19/share YE 2023 • Net loss of $4.6m • Service revenue increased 20% due to increased number of service contracts • Gross Margin of 41% • Op Ex = $14.6m due to increased bad debt provision, increased depreciation, and amortization expenses and increased admin 11 $ in thousands YE 23 YE 22 YoY Change % Revenue Products $ 8,860 $ 11,156 $ (2,296) Services 14,523 12,060 2,463 Energy Production 1,756 1,786 (29) Total Revenue 25,139 25,002 138 0.6% Gross Profit Products 2,937 3,743 (806) Services 6,614 6,535 79 Energy Production 651 789 (138) Total Gross Profit 10,202 11,066 (865) -7.8% Gross Margin: % Products 33% 34% 0% Services 46% 54% -9% Energy Production 37% 44% -7% Total Gross Margin 41% 44% -4% Operating Expenses General & administrative 11,880 10,909 971 Selling 1,931 1,811 120 Research and development 840 733 107 Impairment and other expenses (36) (37) 1 Total operating expenses 14,615 13,416 1,201 8.9% Operating loss (4,414) (2,349) (2,065) -87.9% Net loss $ (4,598) $ (2,448) $ (2,150) -87.8%
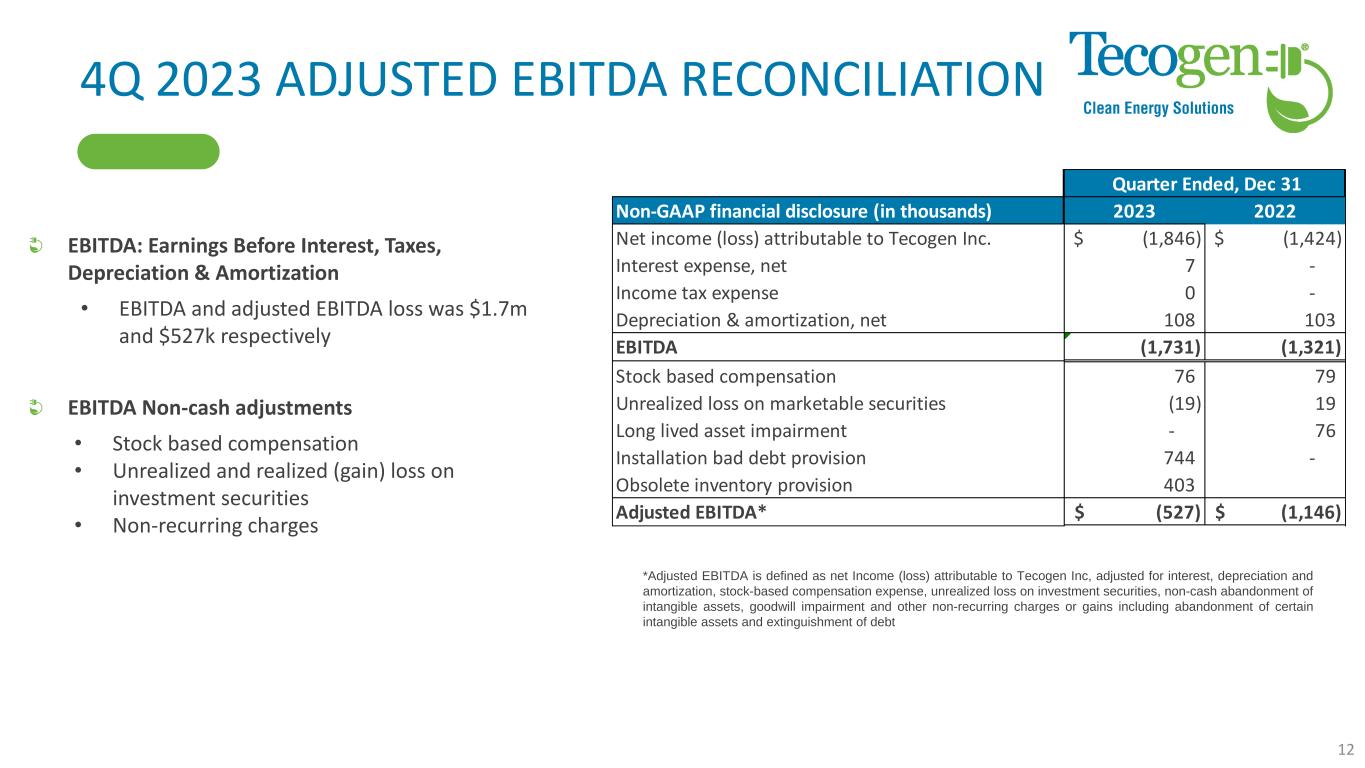
4Q 2023 ADJUSTED EBITDA RECONCILIATION EBITDA: Earnings Before Interest, Taxes, Depreciation & Amortization • EBITDA and adjusted EBITDA loss was $1.7m and $527k respectively EBITDA Non-cash adjustments • Stock based compensation • Unrealized and realized (gain) loss on investment securities • Non-recurring charges *Adjusted EBITDA is defined as net Income (loss) attributable to Tecogen Inc, adjusted for interest, depreciation and amortization, stock-based compensation expense, unrealized loss on investment securities, non-cash abandonment of intangible assets, goodwill impairment and other non-recurring charges or gains including abandonment of certain intangible assets and extinguishment of debt 12 Non-GAAP financial disclosure (in thousands) 2023 2022 Net income (loss) attributable to Tecogen Inc. (1,846)$ (1,424)$ Interest expense, net 7 - Income tax expense 0 - Depreciation & amortization, net 108 103 EBITDA (1,731) (1,321) Stock based compensation 76 79 Unrealized loss on marketable securities (19) 19 Long lived asset impairment - 76 Installation bad debt provision 744 - Obsolete inventory provision 403 Adjusted EBITDA* (527)$ (1,146)$ Quarter Ended, Dec 31
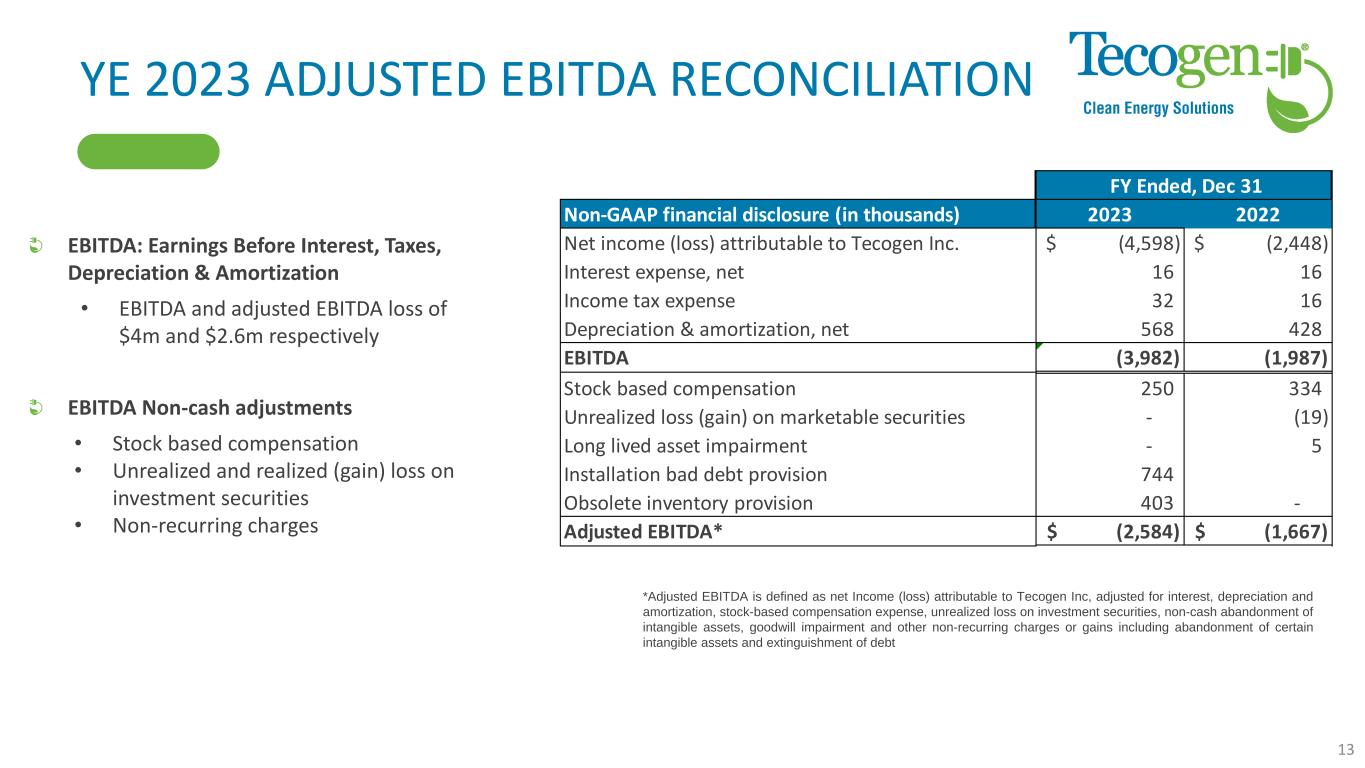
YE 2023 ADJUSTED EBITDA RECONCILIATION EBITDA: Earnings Before Interest, Taxes, Depreciation & Amortization • EBITDA and adjusted EBITDA loss of $4m and $2.6m respectively EBITDA Non-cash adjustments • Stock based compensation • Unrealized and realized (gain) loss on investment securities • Non-recurring charges *Adjusted EBITDA is defined as net Income (loss) attributable to Tecogen Inc, adjusted for interest, depreciation and amortization, stock-based compensation expense, unrealized loss on investment securities, non-cash abandonment of intangible assets, goodwill impairment and other non-recurring charges or gains including abandonment of certain intangible assets and extinguishment of debt 13 Non-GAAP financial disclosure (in thousands) 2023 2022 Net income (loss) attributable to Tecogen Inc. (4,598)$ (2,448)$ Interest expense, net 16 16 Income tax expense 32 16 Depreciation & amortization, net 568 428 EBITDA (3,982) (1,987) Stock based compensation 250 334 Unrealized loss (gain) on marketable securities - (19) Long lived asset impairment - 5 Installation bad debt provision 744 Obsolete inventory provision 403 - Adjusted EBITDA* (2,584)$ (1,667)$ FY Ended, Dec 31
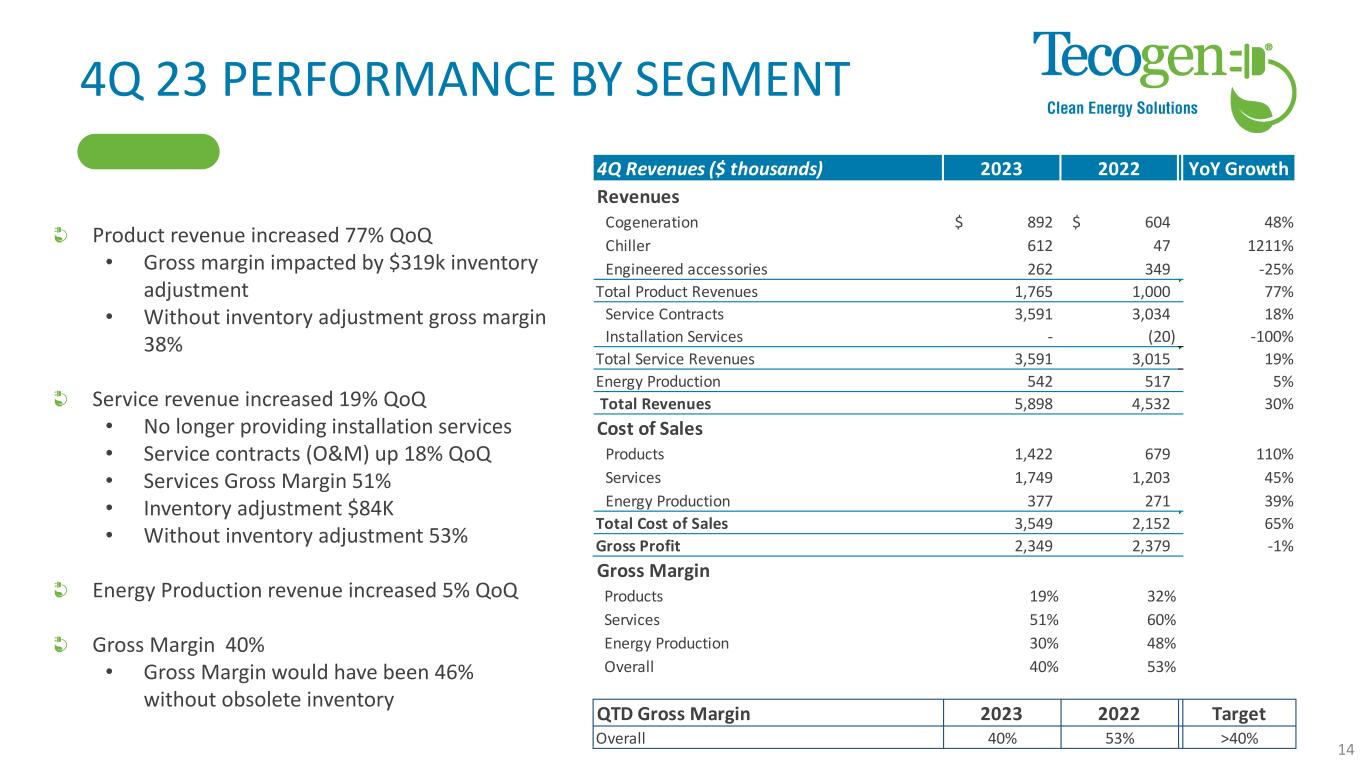
4Q 23 PERFORMANCE BY SEGMENT Product revenue increased 77% QoQ • Gross margin impacted by $319k inventory adjustment • Without inventory adjustment gross margin 38% Service revenue increased 19% QoQ • No longer providing installation services • Service contracts (O&M) up 18% QoQ • Services Gross Margin 51% • Inventory adjustment $84K • Without inventory adjustment 53% Energy Production revenue increased 5% QoQ Gross Margin 40% • Gross Margin would have been 46% without obsolete inventory 14 4Q Revenues ($ thousands) 2023 2022 YoY Growth Revenues Cogeneration 892$ 604$ 48% Chiller 612 47 1211% Engineered accessories 262 349 -25% Total Product Revenues 1,765 1,000 77% Service Contracts 3,591 3,034 18% Installation Services - (20) -100% Total Service Revenues 3,591 3,015 19% Energy Production 542 517 5% Total Revenues 5,898 4,532 30% Cost of Sales Products 1,422 679 110% Services 1,749 1,203 45% Energy Production 377 271 39% Total Cost of Sales 3,549 2,152 65% Gross Profit 2,349 2,379 -1% Gross Margin Products 19% 32% Services 51% 60% Energy Production 30% 48% Overall 40% 53% QTD Gross Margin 2023 2022 Target Overall 40% 53% >40%
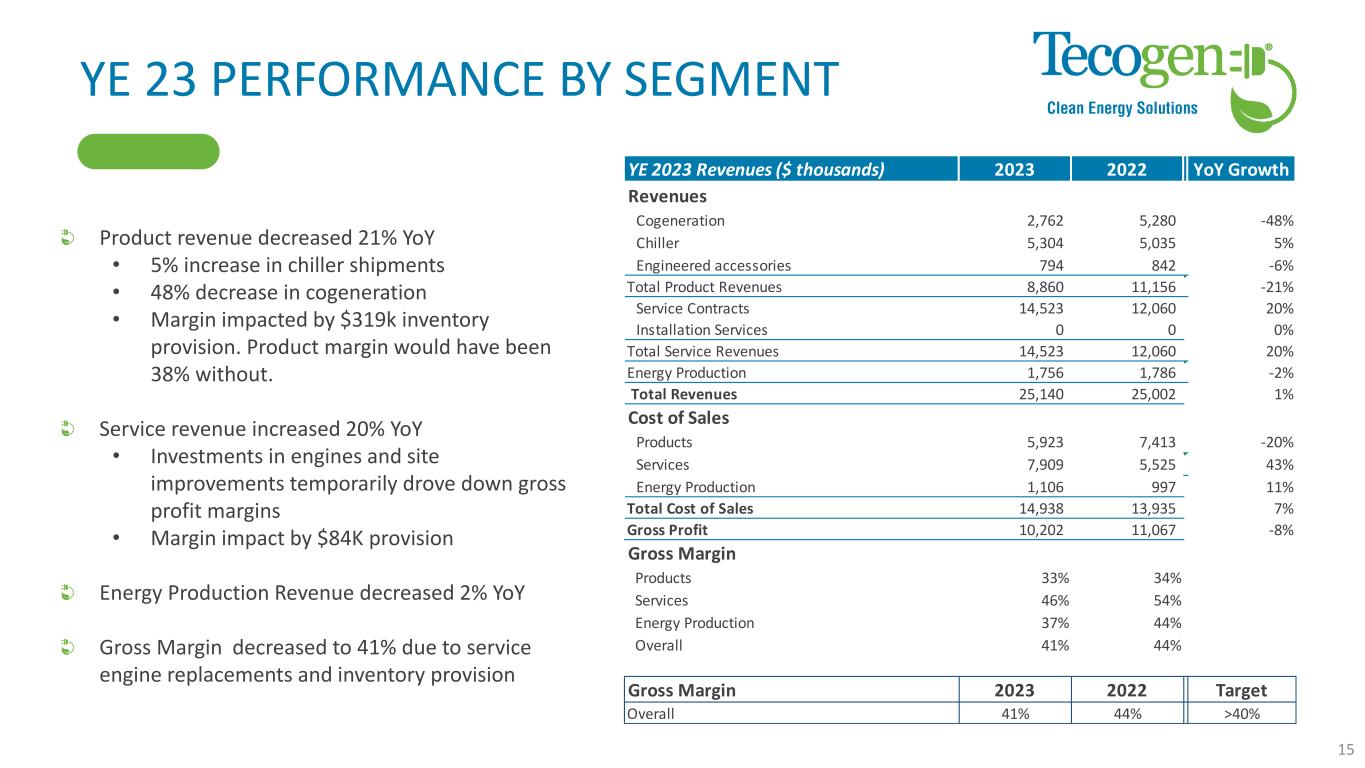
YE 23 PERFORMANCE BY SEGMENT Product revenue decreased 21% YoY • 5% increase in chiller shipments • 48% decrease in cogeneration • Margin impacted by $319k inventory provision. Product margin would have been 38% without. Service revenue increased 20% YoY • Investments in engines and site improvements temporarily drove down gross profit margins • Margin impact by $84K provision Energy Production Revenue decreased 2% YoY Gross Margin decreased to 41% due to service engine replacements and inventory provision 15 YE 2023 Revenues ($ thousands) 2023 2022 YoY Growth Revenues Cogeneration 2,762 5,280 -48% Chiller 5,304 5,035 5% Engineered accessories 794 842 -6% Total Product Revenues 8,860 11,156 -21% Service Contracts 14,523 12,060 20% Installation Services 0 0 0% Total Service Revenues 14,523 12,060 20% Energy Production 1,756 1,786 -2% Total Revenues 25,140 25,002 1% Cost of Sales Products 5,923 7,413 -20% Services 7,909 5,525 43% Energy Production 1,106 997 11% Total Cost of Sales 14,938 13,935 7% Gross Profit 10,202 11,067 -8% Gross Margin Products 33% 34% Services 46% 54% Energy Production 37% 44% Overall 41% 44% Gross Margin 2023 2022 Target Overall 41% 44% >40%
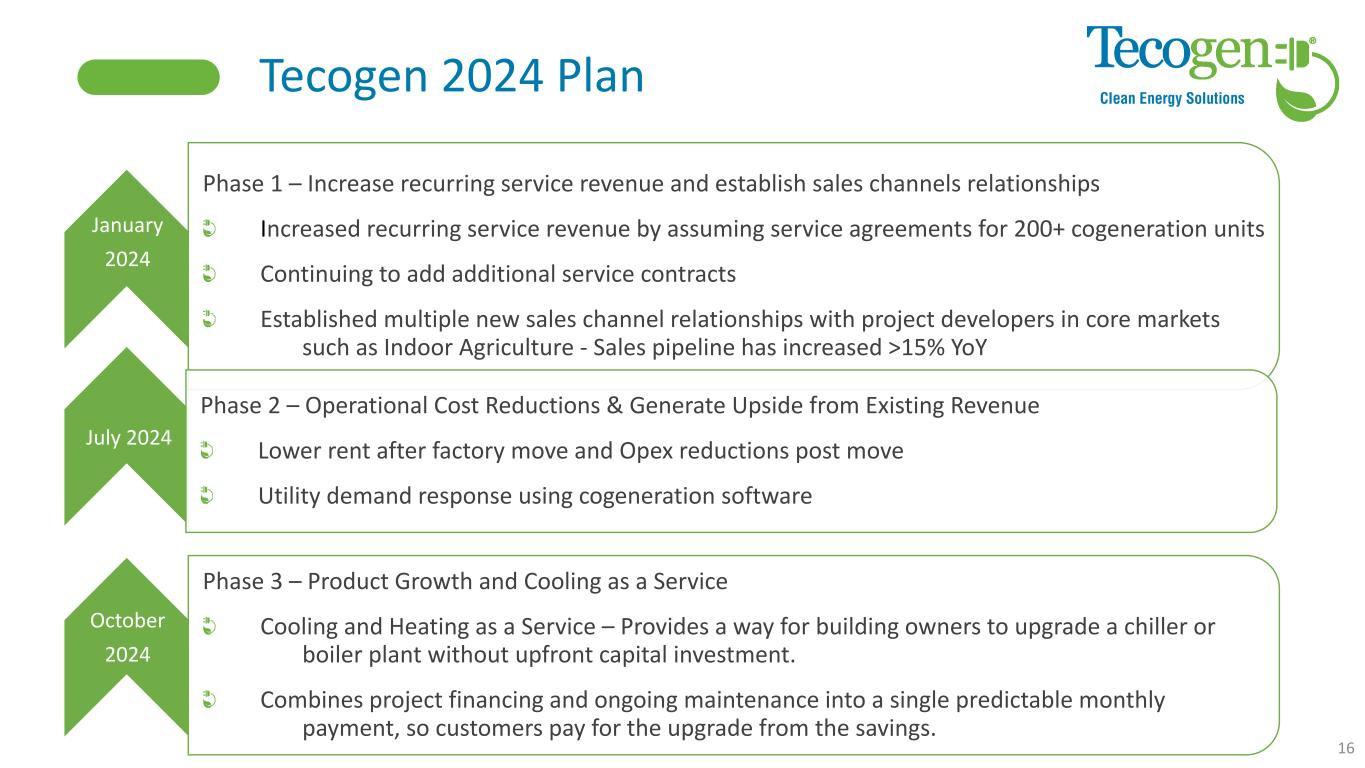
Tecogen 2024 Plan Phase 1 – Increase recurring service revenue and establish sales channels relationships Increased recurring service revenue by assuming service agreements for 200+ cogeneration units Continuing to add additional service contracts Established multiple new sales channel relationships with project developers in core markets such as Indoor Agriculture - Sales pipeline has increased >15% YoY Phase 2 – Operational Cost Reductions & Generate Upside from Existing Revenue Lower rent after factory move and Opex reductions post move Utility demand response using cogeneration software Phase 3 – Product Growth and Cooling as a Service Cooling and Heating as a Service – Provides a way for building owners to upgrade a chiller or boiler plant without upfront capital investment. Combines project financing and ongoing maintenance into a single predictable monthly payment, so customers pay for the upgrade from the savings. 16 January 2024 July 2024 October 2024
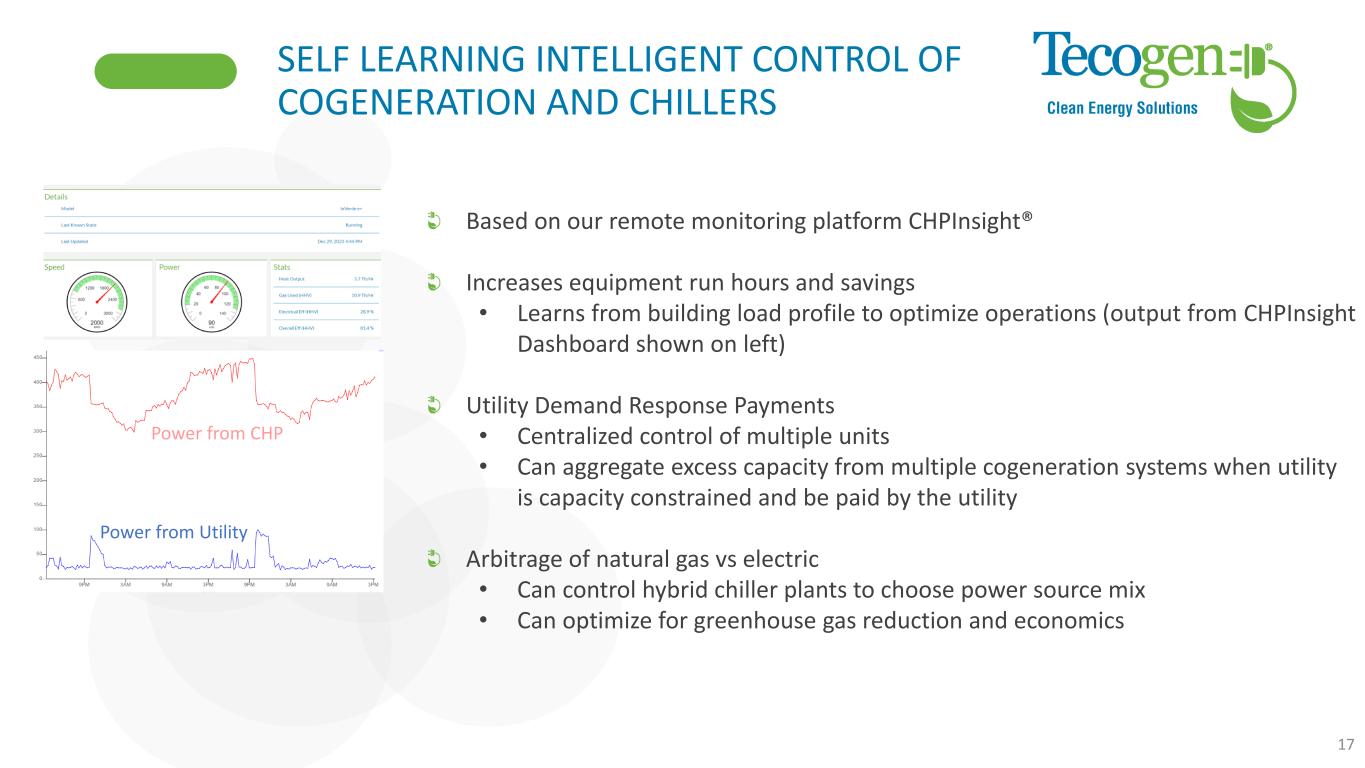
SELF LEARNING INTELLIGENT CONTROL OF COGENERATION AND CHILLERS 17 Based on our remote monitoring platform CHPInsight® Increases equipment run hours and savings • Learns from building load profile to optimize operations (output from CHPInsight Dashboard shown on left) Utility Demand Response Payments • Centralized control of multiple units • Can aggregate excess capacity from multiple cogeneration systems when utility is capacity constrained and be paid by the utility Arbitrage of natural gas vs electric • Can control hybrid chiller plants to choose power source mix • Can optimize for greenhouse gas reduction and economics Power from Utility Power from CHP
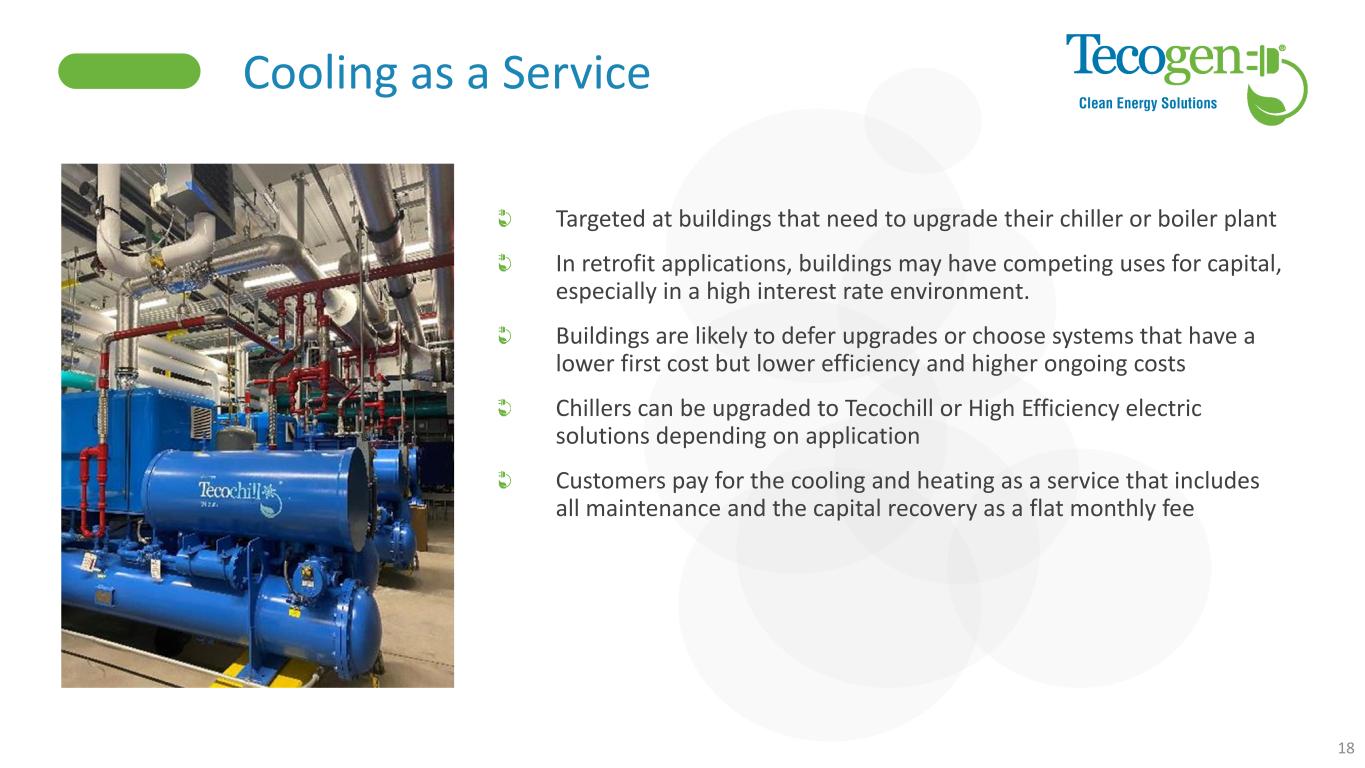
Cooling as a Service 18 Targeted at buildings that need to upgrade their chiller or boiler plant In retrofit applications, buildings may have competing uses for capital, especially in a high interest rate environment. Buildings are likely to defer upgrades or choose systems that have a lower first cost but lower efficiency and higher ongoing costs Chillers can be upgraded to Tecochill or High Efficiency electric solutions depending on application Customers pay for the cooling and heating as a service that includes all maintenance and the capital recovery as a flat monthly fee
SUMMARY AND Q&A Company Information Tecogen, Inc 45 First Ave Waltham, MA 02451 www.Tecogen.com Contact information Abinand Rangesh, CEO 781.466.6487 Abinand.rangesh@Tecogen.com 19 Continuing to focus on cashflow Pivoting to adapt to changing market Continuing to grow service division Continuing to expand margin on service Opex reduction post factory move Close the larger projects